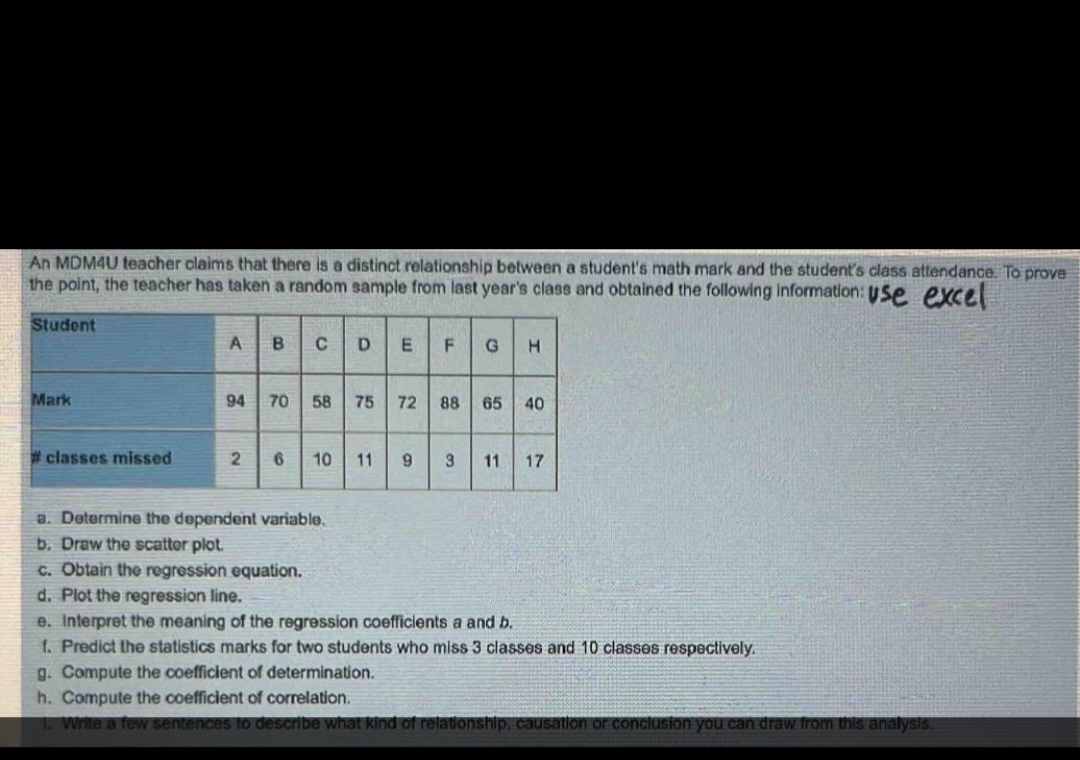
An MDM4U teacher claims that there is a distinct relationship between a student's math mark and the student's class attendance. To prove the point, the teacher has taken a random sample from last year's class and obtained the following information: Use excel Student BCDEFG Mark #classes missed A 94 70 58 75 72 88 65 40 2 6 10 11 9 3 11 17 a. Determine the dependent variable. b. Draw the scatter plot. H c. Obtain the regression equation. d. Plot the regression line. e. Interpret the meaning of the regression coefficients a and b. f. Predict the statistics marks for two students who miss 3 classes and 10 classes respectively. g. Compute the coefficient of determination. h. Compute the coefficient of correlation.
An MDM4U teacher claims that there is a distinct relationship between a student's math mark and the student's class attendance. To prove the point, the teacher has taken a random sample from last year's class and obtained the following information: Use excel Student BCDEFG Mark #classes missed A 94 70 58 75 72 88 65 40 2 6 10 11 9 3 11 17 a. Determine the dependent variable. b. Draw the scatter plot. H c. Obtain the regression equation. d. Plot the regression line. e. Interpret the meaning of the regression coefficients a and b. f. Predict the statistics marks for two students who miss 3 classes and 10 classes respectively. g. Compute the coefficient of determination. h. Compute the coefficient of correlation.
Linear Algebra: A Modern Introduction
4th Edition
ISBN:9781285463247
Author:David Poole
Publisher:David Poole
Chapter7: Distance And Approximation
Section7.3: Least Squares Approximation
Problem 31EQ
Related questions
Question

Transcribed Image Text:An MDM4U teacher claims that there is a distinct relationship between a student's math mark and the student's class attendance. To prove
the point, the teacher has taken a random sample from last year's class and obtained the following information: Use excel
Student
BCDEF
Mark
#classes missed
A
94
70 58
2 6
10
75
H
72 88 65 40
11 9 3 11 17
a. Determine the dependent variable.
b. Draw the scatter plot.
c. Obtain the regression equation.
d. Plot the regression line.
e. Interpret the meaning of the regression coefficients a and b.
f. Predict the statistics marks for two students who miss 3 classes and 10 classes respectively.
g. Compute the coefficient of determination.
h. Compute the coefficient of correlation.
1. Write a few sentences to describe what kind of relationship, causation or conclusion you can draw from this analysis.
Expert Solution
This question has been solved!
Explore an expertly crafted, step-by-step solution for a thorough understanding of key concepts.
Step by step
Solved in 5 steps with 2 images

Recommended textbooks for you

Linear Algebra: A Modern Introduction
Algebra
ISBN:
9781285463247
Author:
David Poole
Publisher:
Cengage Learning

Glencoe Algebra 1, Student Edition, 9780079039897…
Algebra
ISBN:
9780079039897
Author:
Carter
Publisher:
McGraw Hill

Linear Algebra: A Modern Introduction
Algebra
ISBN:
9781285463247
Author:
David Poole
Publisher:
Cengage Learning

Glencoe Algebra 1, Student Edition, 9780079039897…
Algebra
ISBN:
9780079039897
Author:
Carter
Publisher:
McGraw Hill