andom sample selected from the above population yielded the following data: 500 525 425 445 280 490 540 405 320 The sample mean is $445.44 a $441.03 $436.67 $432.34 d The sample variance is 8087.50 a b. 7352.27 7188.89 6076.26 The number ofsamples of sizen 9 selected from this population is 7.288E+15 7.288 Quadrillion 7.008 Quadrillion 6.738 Quadrillion a b 7.008E+15 6.738E+15 6.4701
andom sample selected from the above population yielded the following data: 500 525 425 445 280 490 540 405 320 The sample mean is $445.44 a $441.03 $436.67 $432.34 d The sample variance is 8087.50 a b. 7352.27 7188.89 6076.26 The number ofsamples of sizen 9 selected from this population is 7.288E+15 7.288 Quadrillion 7.008 Quadrillion 6.738 Quadrillion a b 7.008E+15 6.738E+15 6.4701

Glencoe Algebra 1, Student Edition, 9780079039897, 0079039898, 2018
18th Edition
ISBN:9780079039897
Author:Carter
Publisher:Carter
Chapter10: Statistics
Section10.3: Measures Of Spread
Problem 25PFA

Related questions
Question
A1
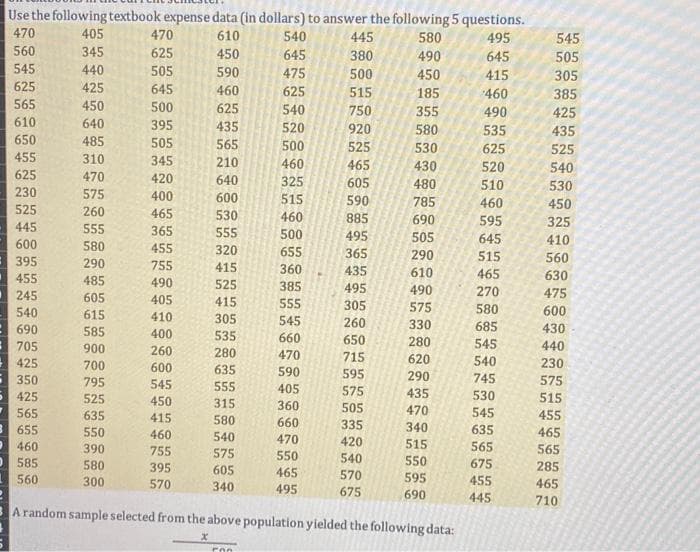
Transcribed Image Text:Use the following textbook expense data (in dollars) to answer the following 5 questions.
470
405
470
610
540
445
580
495
545
560
345
625
450
645
380
490
645
505
545
440
505
590
475
500
450
415
305
625
425
645
460
625
515
185
460
385
565
450
500
625
540
750
355
490
425
610
640
395
435
520
920
580
535
435
650
485
505
565
500
525
530
625
525
455
310
345
210
460
465
430
520
540
625
470
420
640
325
605
480
510
530
230
575
400
600
515
590
785
460
450
525
260
465
530
460
885
690
595
325
445
555
365
555
500
495
365
600
580
505
645
410
455
320
655
290
515
395
290
755
560
415
360
435
610
465
630
455
485
490
525
385
245
495
490
270
475
605
405
415
555
305
575
580
600
540
: 690
=705
615
410
305
545
260
330
685
430
585
400
535
660
650
280
545
440
900
260
280
470
425
715
620
540
230
700
600
635
590
595
350
795
290
745
575
545
555
405
575
425
525
435
530
515
450
315
360
505
565
635
470
545
455
415
580
660
335
655
550
460
340
635
465
540
470
420
515
460
390
755
575
565
565
550
540
550
585
580
395
605
675
285
560
465
570
595
455
300
570
340
495
465
675
690
445
710
A random sample selected from the above population yielded the following data:
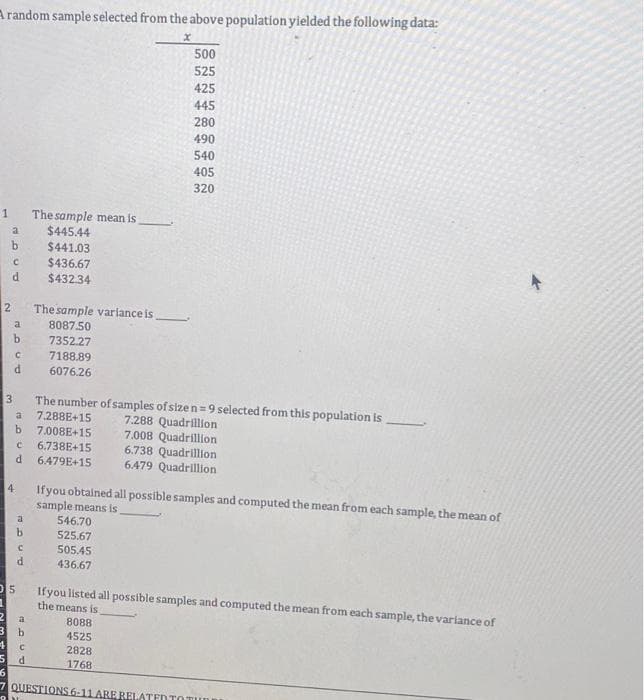
Transcribed Image Text:A random sample selected from the above population yielded the following data:
500
525
425
445
280
490
540
405
320
The sample mean is
$445.44
1
a.
$441.03
$436.67
$432.34
d
The sample variance is
8087.50
7352.27
a
b.
7188.89
6076.26
The number ofsamples of sizen=9 selected from this population is
7.288E+15
3
7.288 Quadrillion
7.008 Quadrillion
6.738 Quadrillion
6.479 Quadrillion
a
b.
7.008E+15
6.738E+15
6.479E+15
Ifyou obtained all possible samples and computed the mean from each sample, the mean of
sample means is
546.70
525.67
505.45
4
a
b
d
436.67
Ifyou listed all possible samples and computed the mean from each sample, the variance of
the means is
a
8088
4525
2828
d.
1768
7 QUESTIONS 6-11 ARE RELATED TOTUnE
Expert Solution
This question has been solved!
Explore an expertly crafted, step-by-step solution for a thorough understanding of key concepts.

Step by step
Solved in 2 steps

Recommended textbooks for you
Glencoe Algebra 1, Student Edition, 9780079039897…
Algebra
ISBN:
9780079039897
Author:
Carter
Publisher:
McGraw Hill
Glencoe Algebra 1, Student Edition, 9780079039897…
Algebra
ISBN:
9780079039897
Author:
Carter
Publisher:
McGraw Hill