And and Average Returns for Stocks, Bonds, and T-Bills, 1950 to 2017 Long-Term Treasury 1950 to 2017 1950 to 1959 1960 to 1969 1970 to 1979 1980 to 1989 1990 to 1999 2000 to 2009 Average Average Average Average Average Average Average Annual Return 2010 2011 Annual Return 2012 Annual Return 2013 Annual Return 2014 Annual Return 2015 Annual Return 2016 Annual Return 2017 Annual Return Average 2010 to 2017 Stocks 12.7% 20.9 8.7 7.5 18.2 19.0 0.9 15.1 2.1 16.0 32.4 13.7 1.4 12.0 21.8 14.3 Bonds 6.6% 0.0 1.6 5.7 13.5 9.5 8.0 9.4 29.9 3.6 -12.7 25.1 -1.2 1.2 8.4 8.0 T-bills 4.30% 2.00 4.00 6.30 8.90 4.90 2.70 0.01 0.02 0.02 0.07 0.05 0.21 0.51 1.39 0.29 You have a portfolio with an asset allocation of 60 percent stocks, 30 percent long-term Treasury bonds, and 10 percent T-bills. Use these weights and the returns given in the above table to compute the return of the portfolio in the year 2010 and each year since. Then compute the average annual return and standard deviation of the portfolio. (Do not round intermediate calculations. Round your answers to 2 decimal places.)
And and Average Returns for Stocks, Bonds, and T-Bills, 1950 to 2017 Long-Term Treasury 1950 to 2017 1950 to 1959 1960 to 1969 1970 to 1979 1980 to 1989 1990 to 1999 2000 to 2009 Average Average Average Average Average Average Average Annual Return 2010 2011 Annual Return 2012 Annual Return 2013 Annual Return 2014 Annual Return 2015 Annual Return 2016 Annual Return 2017 Annual Return Average 2010 to 2017 Stocks 12.7% 20.9 8.7 7.5 18.2 19.0 0.9 15.1 2.1 16.0 32.4 13.7 1.4 12.0 21.8 14.3 Bonds 6.6% 0.0 1.6 5.7 13.5 9.5 8.0 9.4 29.9 3.6 -12.7 25.1 -1.2 1.2 8.4 8.0 T-bills 4.30% 2.00 4.00 6.30 8.90 4.90 2.70 0.01 0.02 0.02 0.07 0.05 0.21 0.51 1.39 0.29 You have a portfolio with an asset allocation of 60 percent stocks, 30 percent long-term Treasury bonds, and 10 percent T-bills. Use these weights and the returns given in the above table to compute the return of the portfolio in the year 2010 and each year since. Then compute the average annual return and standard deviation of the portfolio. (Do not round intermediate calculations. Round your answers to 2 decimal places.)

Fundamentals of Financial Management, Concise Edition (with Thomson ONE - Business School Edition, 1 term (6 months) Printed Access Card) (MindTap Course List)
8th Edition
ISBN:9781285065137
Author:Eugene F. Brigham, Joel F. Houston
Publisher:Eugene F. Brigham, Joel F. Houston
Chapter8: Risk And Rates Of Return
Section: Chapter Questions
Problem 22SP

Related questions
Question
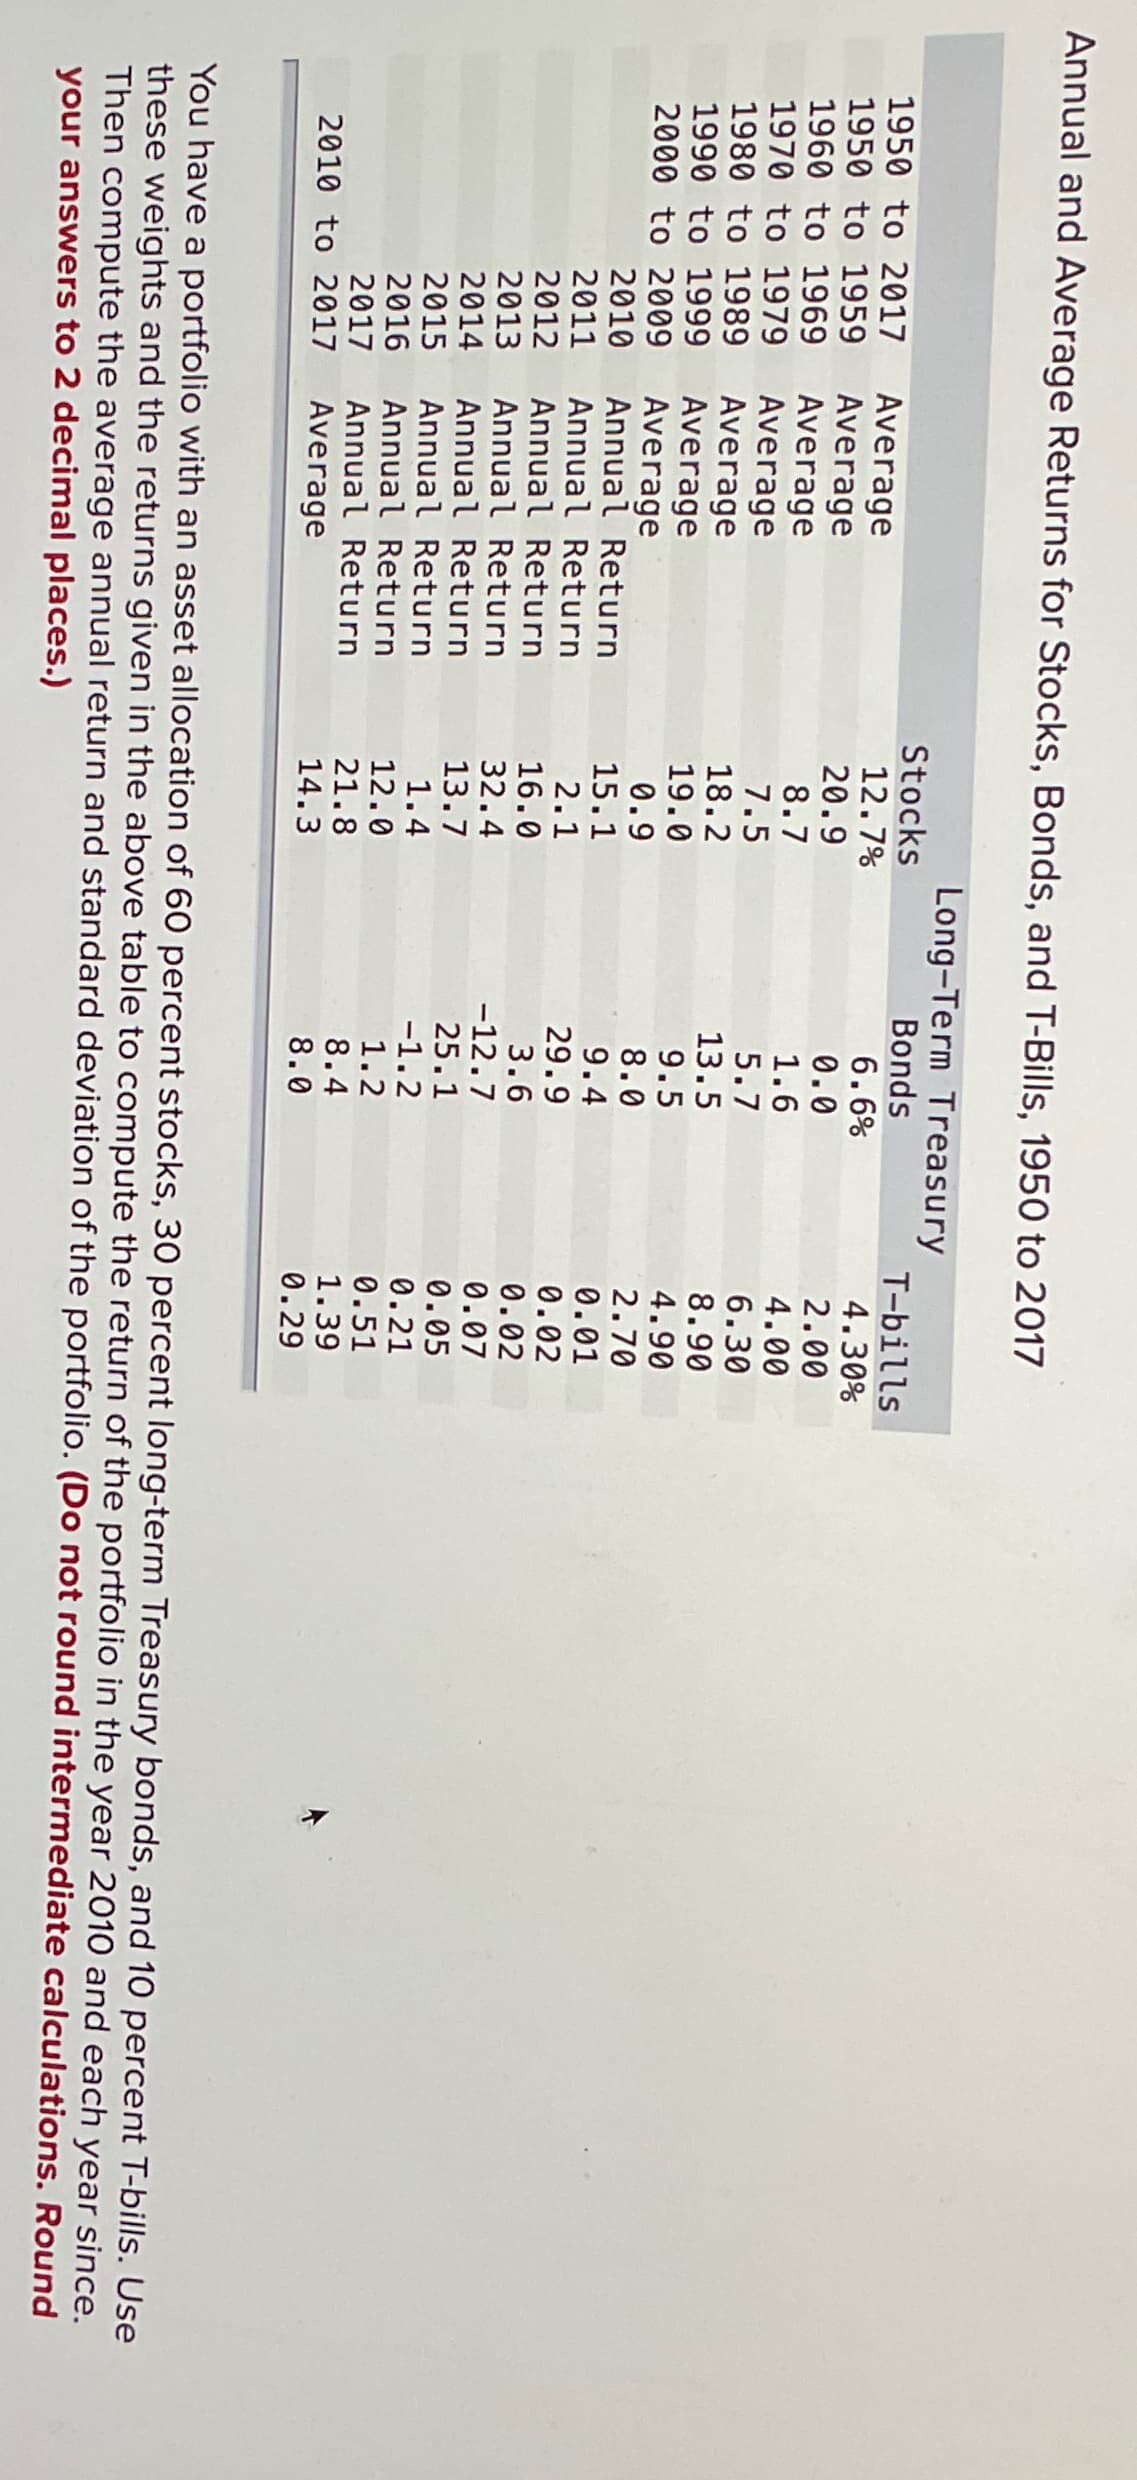
Transcribed Image Text:Annual and Average Returns for Stocks, Bonds, and T-Bills, 1950 to 2017
Long-Term Treasury
1950 to 2017 Average
1950 to 1959
Average
1960 to 1969
Average
1970 to 1979
Average
1980 to 1989
Average
1990 to 1999
Average
2000 to 2009
Average
2010
Annual Return
2011 Annual Return
2012 Annual Return
2013 Annual Return
2014 Annual Return
2015 Annual Return
2016 Annual Return
2017
Annual Return
Average
2010 to 2017
Stocks
12.7%
20.9
8.7
7.5
18.2
19.0
0.9
15.1
2.1
16.0
32.4
13.7
1.4
12.0
21.8
14.3
Bonds
6.6%
0.0
1.6
5.7
13.5
9.5
8.0
9.4
29.9
3.6
-12.7
25.1
-1.2
1.2
8.4
8.0
T-bills
4.30%
2.00
4.00
6.30
8.90
4.90
2.70
0.01
0.02
0.02
0.07
0.05
0.21
0.51
1.39
0.29
You have a portfolio with an asset allocation of 60 percent stocks, 30 percent long-term Treasury bonds, and 10 percent T-bills. Use
these weights and the returns given in the above table to compute the return of the portfolio in the year 2010 and each year since.
Then compute the average annual return and standard deviation of the portfolio. (Do not round intermediate calculations. Round
your answers to 2 decimal places.)
Expert Solution
This question has been solved!
Explore an expertly crafted, step-by-step solution for a thorough understanding of key concepts.

This is a popular solution!

Trending now
This is a popular solution!

Step by step
Solved in 3 steps with 2 images

Recommended textbooks for you
Fundamentals of Financial Management, Concise Edi…
Finance
ISBN:
9781285065137
Author:
Eugene F. Brigham, Joel F. Houston
Publisher:
Cengage Learning

Fundamentals of Financial Management, Concise Edi…
Finance
ISBN:
9781305635937
Author:
Eugene F. Brigham, Joel F. Houston
Publisher:
Cengage Learning

Fundamentals of Financial Management (MindTap Cou…
Finance
ISBN:
9781285867977
Author:
Eugene F. Brigham, Joel F. Houston
Publisher:
Cengage Learning
Fundamentals of Financial Management, Concise Edi…
Finance
ISBN:
9781285065137
Author:
Eugene F. Brigham, Joel F. Houston
Publisher:
Cengage Learning
Fundamentals of Financial Management, Concise Edi…
Finance
ISBN:
9781305635937
Author:
Eugene F. Brigham, Joel F. Houston
Publisher:
Cengage Learning
Fundamentals of Financial Management (MindTap Cou…
Finance
ISBN:
9781285867977
Author:
Eugene F. Brigham, Joel F. Houston
Publisher:
Cengage Learning

Fundamentals Of Financial Management, Concise Edi…
Finance
ISBN:
9781337902571
Author:
Eugene F. Brigham, Joel F. Houston
Publisher:
Cengage Learning