Annual Data | Millions of US $ except per share data Cash On Hand Receivables Inventory Pre-Paid Expenses Other Current Assets Total Current Assets Property, Plant, And Equipment Long-Term Investments Goodwill And Intangible Assets Other Long-Term Assets Total Long-Term Assets tal Assets Total Current Liabilities Long Term Debt Other Non-Current Liabilities Total Long Term Liabilities tal Liabilities Common Stock Net Retained Earnings (Accumulated Deficit) Comprehensive Income Other Share Holders Equity are Holder Equity tal Liabilities And Share Holders Equity 2018-12-31 $866 $2,441.5 $51.1 $694.6 $4,053.2 $22,842.7 $1,202.8 $2,331.5 $2,381 $28,758 $32,811.2 $2,973.5 $31,075.3 $3,177.5 $36,096.1 $39,069.6 $16.6 $50,487 $-2,609.5 $-6,258.4 $32,811.2 2017-12-31 $2,463.8 $1,976.2 $58.8 $828.4 $5,327.2 $22,448.3 $1,085.7 $2,379.7 $2,562.8 $28,476.5 $33,803.7 $2,890.6 $29,536.4 $3,525.3 $34,181.1 $37,071.7 $16.6 $48,325.8 $-2,178.4 $-3,268 $33,803.7 2016-12-31 $1,223,4 $1,474.1 $58.9 $565.2 $1,527 $4,848.6 $21,257.6 $725.9 $2,336.5 $1,855.3 $26,175.3 $31,023.9 $3,468.3 $25,878.5 $2,064.3 $29,759.9 $33,228.2 $16.6 $46,222.7 $-3,092.9 $-2,204.3 $31,023.9 2015-12-31 $7,685.5 $1,298.7 $100.1 $558.7 $9,643 $23,117.6 $792.7 $2,516.3 $1,869.1 $28,295.7 $37,938.7 $2,950.4 $24,122.1 $2,074 $27,900.4 $30,850.8 $16.6 $44,594.5 $-2,879.8 $7,087.9 $37,938.7 2014-12-31 $2,077.9 $1,214.4 $110 $783.2 $4,185.5 $24,557.5 $1,004.5 $2,735.3 $1,744.6 $30,041.9 $34,227.4 $2,747.9 $14,935.7 $2,065.9 $18,626.1 $21,374 $16.6 $43,294.5 $-1,519.7 $12,853.4 $34,227.4
Annual Data | Millions of US $ except per share data Cash On Hand Receivables Inventory Pre-Paid Expenses Other Current Assets Total Current Assets Property, Plant, And Equipment Long-Term Investments Goodwill And Intangible Assets Other Long-Term Assets Total Long-Term Assets tal Assets Total Current Liabilities Long Term Debt Other Non-Current Liabilities Total Long Term Liabilities tal Liabilities Common Stock Net Retained Earnings (Accumulated Deficit) Comprehensive Income Other Share Holders Equity are Holder Equity tal Liabilities And Share Holders Equity 2018-12-31 $866 $2,441.5 $51.1 $694.6 $4,053.2 $22,842.7 $1,202.8 $2,331.5 $2,381 $28,758 $32,811.2 $2,973.5 $31,075.3 $3,177.5 $36,096.1 $39,069.6 $16.6 $50,487 $-2,609.5 $-6,258.4 $32,811.2 2017-12-31 $2,463.8 $1,976.2 $58.8 $828.4 $5,327.2 $22,448.3 $1,085.7 $2,379.7 $2,562.8 $28,476.5 $33,803.7 $2,890.6 $29,536.4 $3,525.3 $34,181.1 $37,071.7 $16.6 $48,325.8 $-2,178.4 $-3,268 $33,803.7 2016-12-31 $1,223,4 $1,474.1 $58.9 $565.2 $1,527 $4,848.6 $21,257.6 $725.9 $2,336.5 $1,855.3 $26,175.3 $31,023.9 $3,468.3 $25,878.5 $2,064.3 $29,759.9 $33,228.2 $16.6 $46,222.7 $-3,092.9 $-2,204.3 $31,023.9 2015-12-31 $7,685.5 $1,298.7 $100.1 $558.7 $9,643 $23,117.6 $792.7 $2,516.3 $1,869.1 $28,295.7 $37,938.7 $2,950.4 $24,122.1 $2,074 $27,900.4 $30,850.8 $16.6 $44,594.5 $-2,879.8 $7,087.9 $37,938.7 2014-12-31 $2,077.9 $1,214.4 $110 $783.2 $4,185.5 $24,557.5 $1,004.5 $2,735.3 $1,744.6 $30,041.9 $34,227.4 $2,747.9 $14,935.7 $2,065.9 $18,626.1 $21,374 $16.6 $43,294.5 $-1,519.7 $12,853.4 $34,227.4
Managerial Accounting
15th Edition
ISBN:9781337912020
Author:Carl Warren, Ph.d. Cma William B. Tayler
Publisher:Carl Warren, Ph.d. Cma William B. Tayler
Chapter16: Financial Statement Analysis
Section: Chapter Questions
Problem 4PB
Related questions
Question
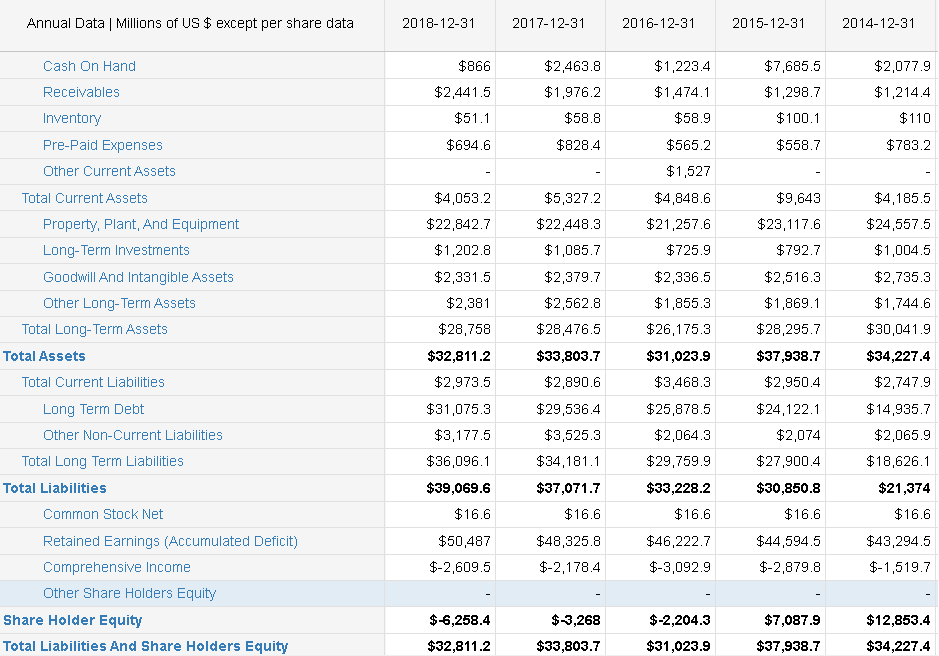
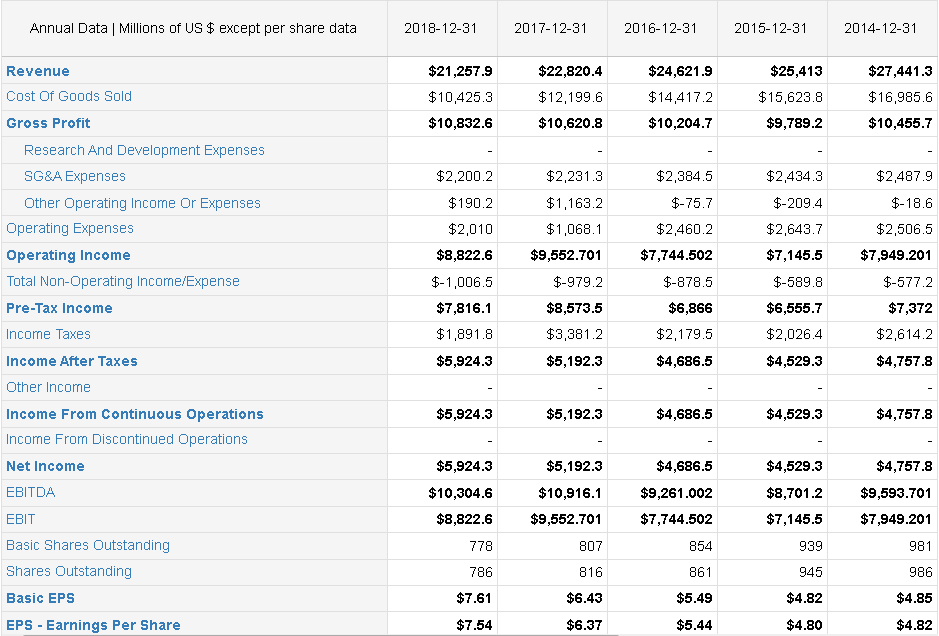
perform horizontal and vertical analysis, financial ratio analysis, breakeven analysis
discuss the findings in details

Transcribed Image Text:Annual Data | Millions of US $ except per share data
Cash On Hand
Receivables
Inventory
Pre-Paid Expenses
Other Current Assets
Total Current Assets
Property, Plant, And Equipment
Long-Term Investments
Goodwill And Intangible Assets
Other Long-Term Assets
Total Long-Term Assets
Total Assets
Total Current Liabilities
Long Term Debt
Other Non-Current Liabilities
Total Long Term Liabilities
Total Liabilities
Common Stock Net
Retained Earnings (Accumulated Deficit)
Comprehensive Income
Other Share Holders Equity
Share Holder Equity
Total Liabilities And Share Holders Equity
2018-12-31
$866
$2,441.5
$51.1
$694.6
$4,053.2
$22,842.7
$1,202.8
$2,331.5
$2,381
$28,758
$32,811.2
$2,973.5
$31,075.3
$3,177.5
$36,096.1
$39,069.6
$16.6
$50,487
$-2,609.5
$-6,258.4
$32,811.2
2017-12-31
$2,463.8
$1,976.2
$58.8
$828.4
$5,327.2
$22,448.3
$1,085.7
$2,379.7
$2,562.8
$28,476.5
$33,803.7
$2,890.6
$29,536.4
$3,525.3
$34,181.1
$37,071.7
$16.6
$48,325.8
$-2,178.4
$-3,268
$33,803.7
2016-12-31
$1,223.4
$1,474.1
$58.9
$565.2
$1,527
$4,848.6
$21,257.6
$725.9
$2,336.5
$1,855.3
$26,175.3
$31,023.9
$3,468.3
$25,878.5
$2,064.3
$29,759.9
$33,228.2
$16.6
$46,222.7
$-3,092.9
$-2,204.3
$31,023.9
2015-12-31
$7,685.5
$1,298.7
$100.1
$558.7
$9,643
$23,117.6
$792.7
$2,516.3
$1,869.1
$28,295.7
$37,938.7
$2,950.4
$24,122.1
$2,074
$27,900.4
$30,850.8
$16.6
$44,594.5
$-2,879.8
$7,087.9
$37,938.7
2014-12-31
$2,077.9
$1,214.4
$110
$783.2
$4,185.5
$24,557.5
$1,004.5
$2,735.3
$1,744.6
$30,041.9
$34,227.4
$2,747.9
$14,935.7
$2,065.9
$18,626.1
$21,374
$16.6
$43,294.5
$-1,519.7
$12,853.4
$34,227.4

Transcribed Image Text:Annual Data | Millions of US $ except per share data
Revenue
Cost Of Goods Sold
Gross Profit
Research And Development Expenses
SG&A Expenses
Other Operating Income Or Expenses
Operating Expenses
Operating Income
Total Non-Operating Income/Expense
Pre-Tax Income
Income Taxes
Income After Taxes
Other Income
Income From Continuous Operations
Income From Discontinued Operations
Net Income
EBITDA
EBIT
Basic Shares Outstanding
Shares Outstanding
Basic EPS
EPS - Earnings Per Share
2018-12-31
$21,257.9
$10,425.3
$10,832.6
$2,200.2
$190.2
$2,010
$8,822.6
$-1,006.5
$7,816.1
$1,891.8
$5,924.3
$5,924.3
$5,924.3
$10,304.6
$8,822.6
778
786
$7.61
$7.54
2017-12-31
$22,820.4
$12,199.6
$10,620.8
$2,231.3
$1,163.2
$1,068.1
$9,552.701
$-979.2
$8,573.5
$3,381.2
$5,192.3
$5,192.3
$5,192.3
$10,916.1
$9,552.701
807
816
$6.43
$6.37
2016-12-31
$24,621.9
$14,417.2
$10,204.7
$2,384.5
$-75.7
$2,460.2
$7,744.502
$-878.5
$6,866
$2,179.5
$4,686.5
$4,686.5
$4,686.5
$9,261.002
$7,744.502
854
861
$5.49
$5.44
2015-12-31
$25,413
$15,623.8
$9,789.2
$2,434.3
$-209.4
$2,643.7
$7,145.5
$-589.8
$6,555.7
$2,026.4
$4,529.3
$4,529.3
$4,529.3
$8,701.2
$7,145.5
939
945
$4.82
$4.80
2014-12-31
$27,441.3
$16,985.6
$10,455.7
$2,487.9
$-18.6
$2,506.5
$7,949.201
$-577.2
$7,372
$2,614.2
$4,757.8
$4,757.8
$4,757.8
$9,593.701
$7,949.201
981
986
$4.85
$4.82
Expert Solution
This question has been solved!
Explore an expertly crafted, step-by-step solution for a thorough understanding of key concepts.
Step by step
Solved in 3 steps with 2 images

Knowledge Booster
Learn more about
Need a deep-dive on the concept behind this application? Look no further. Learn more about this topic, accounting and related others by exploring similar questions and additional content below.Recommended textbooks for you

Managerial Accounting
Accounting
ISBN:
9781337912020
Author:
Carl Warren, Ph.d. Cma William B. Tayler
Publisher:
South-Western College Pub

Survey of Accounting (Accounting I)
Accounting
ISBN:
9781305961883
Author:
Carl Warren
Publisher:
Cengage Learning


Managerial Accounting
Accounting
ISBN:
9781337912020
Author:
Carl Warren, Ph.d. Cma William B. Tayler
Publisher:
South-Western College Pub

Survey of Accounting (Accounting I)
Accounting
ISBN:
9781305961883
Author:
Carl Warren
Publisher:
Cengage Learning
