answer and R code for: 'h' and 'i'

Linear Algebra: A Modern Introduction
4th Edition
ISBN:9781285463247
Author:David Poole
Publisher:David Poole
Chapter4: Eigenvalues And Eigenvectors
Section4.6: Applications And The Perron-frobenius Theorem
Problem 24EQ

Related questions
Question
answer and R code for: 'h' and 'i'
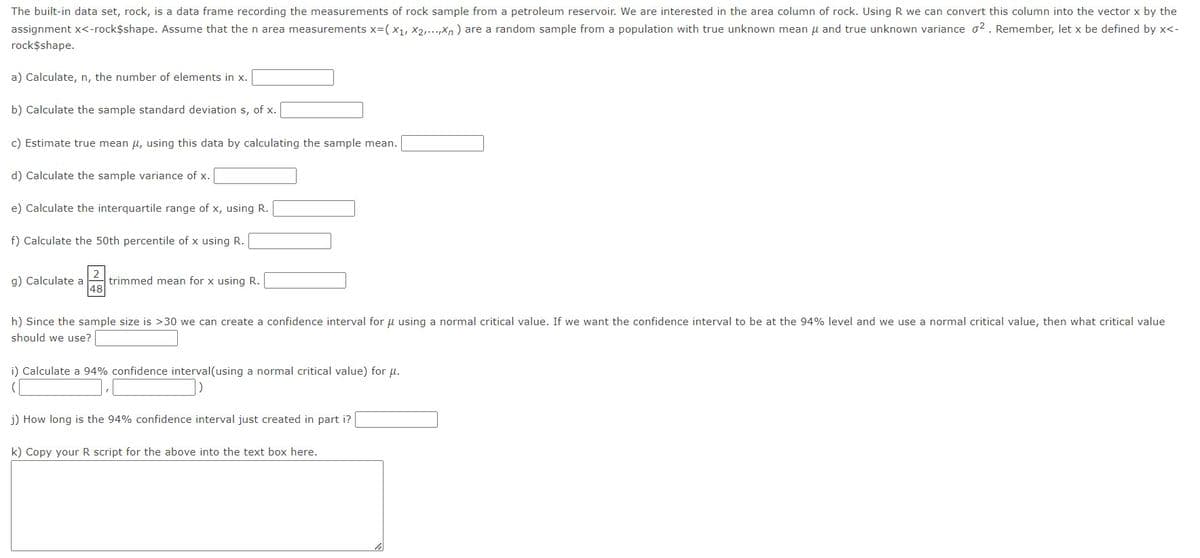
Transcribed Image Text:The built-in data set, rock, is a data frame recording the measurements of rock sample from a petroleum reservoir. We are interested in the area column of rock. Using R we can convert this column into the vector x by the
assignment x<-rock$shape. Assume that the n area measurements x=(X₁, X2,...,xn) are a random sample from a population with true unknown mean μ and true unknown variance 02. Remember, let x be defined by x<-
rock$shape.
a) Calculate, n, the number of elements in x.
b) Calculate the sample standard deviation s, of x.
c) Estimate true mean μ, using this data by calculating the sample mean.
d) Calculate the sample variance of x.
e) Calculate the interquartile range of x, using R.
f) Calculate the 50th percentile of x using R.
g) Calculate a
48
trimmed mean for x using R.
h) Since the sample size is >30 we can create a confidence interval for μ using a normal critical value. If we want the confidence interval to be at the 94% level and we use a normal critical value, then what critical value
should we use?
i) Calculate a 94% confidence interval(using a normal critical value) for μ.
(
j) How long is the 94% confidence interval just created in part i?
k) Copy your R script for the above into the text box here.
Expert Solution
This question has been solved!
Explore an expertly crafted, step-by-step solution for a thorough understanding of key concepts.

Step by step
Solved in 3 steps with 4 images

Recommended textbooks for you
Linear Algebra: A Modern Introduction
Algebra
ISBN:
9781285463247
Author:
David Poole
Publisher:
Cengage Learning

Elementary Linear Algebra (MindTap Course List)
Algebra
ISBN:
9781305658004
Author:
Ron Larson
Publisher:
Cengage Learning
Linear Algebra: A Modern Introduction
Algebra
ISBN:
9781285463247
Author:
David Poole
Publisher:
Cengage Learning
Elementary Linear Algebra (MindTap Course List)
Algebra
ISBN:
9781305658004
Author:
Ron Larson
Publisher:
Cengage Learning