Answer the following The image on the left shows the standard normal distribution curve (with u=0 and a=1). Shade the portion of the graph that represents an area of approximately 68.2%. 95% 9.7% mn- mean-2 mean-is mean mean is mean+ mean- The image on the left shows the standard normal distribution curve (with a-0 and a = 1). Shade the portion of the graph that represents an area of approximately 95.4%. The image on the left shows the standard normal distribution curve (with u=0 and a = 1). Shade the portion of the graph that represents an area of approximately 99.7%.
Answer the following The image on the left shows the standard normal distribution curve (with u=0 and a=1). Shade the portion of the graph that represents an area of approximately 68.2%. 95% 9.7% mn- mean-2 mean-is mean mean is mean+ mean- The image on the left shows the standard normal distribution curve (with a-0 and a = 1). Shade the portion of the graph that represents an area of approximately 95.4%. The image on the left shows the standard normal distribution curve (with u=0 and a = 1). Shade the portion of the graph that represents an area of approximately 99.7%.

Glencoe Algebra 1, Student Edition, 9780079039897, 0079039898, 2018
18th Edition
ISBN:9780079039897
Author:Carter
Publisher:Carter
Chapter10: Statistics
Section10.4: Distributions Of Data
Problem 19PFA

Related questions
Question
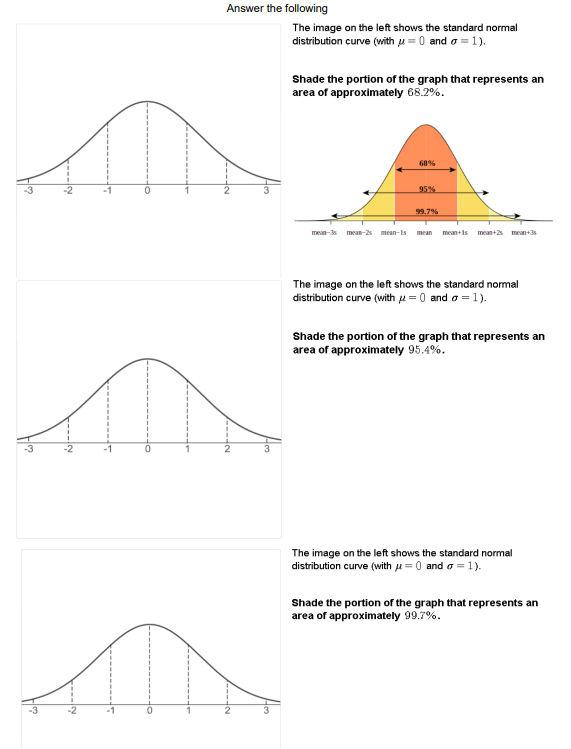
Transcribed Image Text:Answer the following
The image on the left shows the standard normal
distribution curve (with u = 0 and o = 1).
Shade the portion of the graph that represents an
area of approximately 68.2%.
68%
95%
99.7%
mean-3s mean-2 mean-is
mean mean+ls mean+2 mean+
The image on the left shows the standard normal
distribution curve (with u = 0 and o = 1).
Shade the portion of the graph that represents an
area of approximately 95.4%.
The image on the left shows the standard normal
distribution curve (with µ = 0 and o = 1).
Shade the portion of the graph that represents an
area of approximately 99.7%.
---2
Expert Solution
This question has been solved!
Explore an expertly crafted, step-by-step solution for a thorough understanding of key concepts.

This is a popular solution!

Trending now
This is a popular solution!

Step by step
Solved in 2 steps with 2 images

Recommended textbooks for you
Glencoe Algebra 1, Student Edition, 9780079039897…
Algebra
ISBN:
9780079039897
Author:
Carter
Publisher:
McGraw Hill
Glencoe Algebra 1, Student Edition, 9780079039897…
Algebra
ISBN:
9780079039897
Author:
Carter
Publisher:
McGraw Hill