Are cash flows from operations positive? What is the trend for three years? 2. Is operating cash flows smaller or larger than net income? 3. Did the company purchase any property plant and equipment during the last year?
Are cash flows from operations positive? What is the trend for three years? 2. Is operating cash flows smaller or larger than net income? 3. Did the company purchase any property plant and equipment during the last year?

Financial Accounting: The Impact on Decision Makers
10th Edition
ISBN:9781305654174
Author:Gary A. Porter, Curtis L. Norton
Publisher:Gary A. Porter, Curtis L. Norton
Chapter10: Long-term Liabilities
Section: Chapter Questions
Problem 10.12E

Related questions
Question
Statement of Cash flows Analysis
Analyze the statement of cash flows of the companies and find the answers of the followings
1. Are cash flows from operations positive? What is the trend for three years?
2. Is operating cash flows smaller or larger than net income?
3. Did the company purchase any property plant and equipment during the last year?
4. Did the company obtain loan during the last year?
5. Did the company pay dividend?
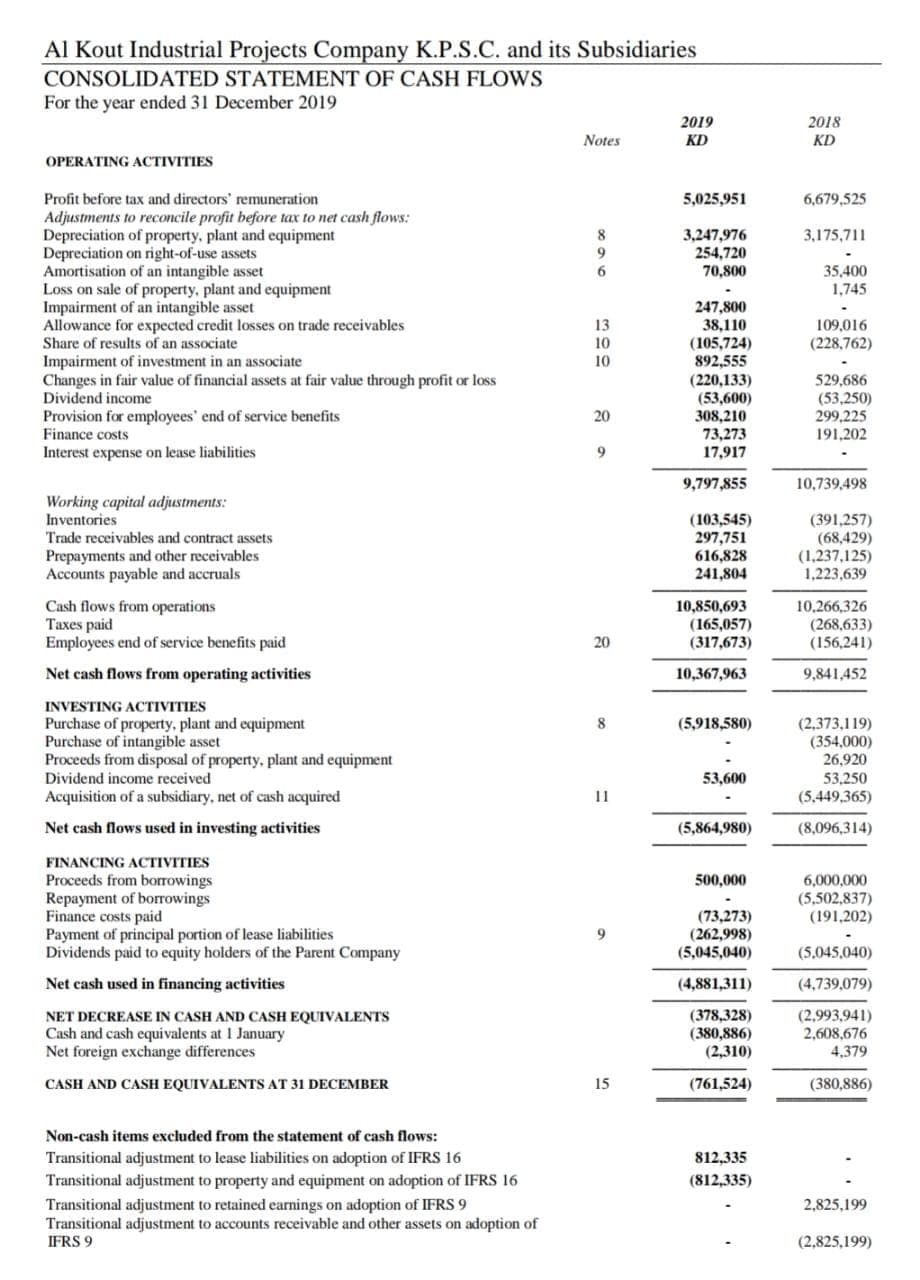
Transcribed Image Text:Al Kout Industrial Projects Company K.P.S.C. and its Subsidiaries
CONSOLIDATED STATEMENT OF CASH FLOWS
For the year ended 31 December 2019
2019
KD
2018
Notes
KD
OPERATING ACTIVITIES
Profit before tax and directors' remuneration
5,025,951
6,679,525
Adjustments to reconcile profit before tax to net cash flows:
Depreciation of property, plant and equipment
Depreciation on right-of-use assets
Amortisation of an intangible asset
Loss on sale of property, plant and equipment
Impairment of an intangible asset
Allowance for expected credit losses on trade receivables
Share of results of an associate
Impairment of investment in an associate
Changes in fair value of financial assets at fair value through profit or loss
Dividend income
8
3,247,976
254,720
70,800
3,175,711
35,400
1,745
13
10
10
247,800
38,110
(105,724)
892,555
109,016
(228,762)
(220,133)
(53,600)
308,210
73,273
17,917
529,686
(53,250)
299,225
191,202
Provision for employees' end of service benefits
Finance costs
20
Interest expense on lease liabilities
9,797,855
10,739,498
Working capital adjustments:
Inventories
Trade receivables and contract assets
(103,545)
297,751
616,828
241,804
(391,257)
(68,429)
(1,237,125)
1,223,639
Prepayments and other receivables
Accounts payable and accruals
Cash flows from operations
Taxes paid
Employees end of service benefits paid
10,850,693
(165,057)
(317,673)
10,266,326
(268,633)
(156,241)
20
Net cash flows from operating activities
10,367,963
9,841,452
INVESTING ACTIVITIES
Purchase of property, plant and equipment
Purchase of intangible asset
Proceeds from disposal of property, plant and equipment
Dividend income received
(5,918,580)
(2,373,119)
(354,000)
26,920
53,250
(5,449,365)
8
53,600
Acquisition of a subsidiary, net of cash acquired
11
Net cash flows used in investing activities
(5,864,980)
(8,096,314)
FINANCING ACTIVITIES
Proceeds from borrowings
Repayment of borrowings
Finance costs paid
Payment of principal portion of lease liabilities
Dividends paid to equity holders of the Parent Company
500,000
6,000,000
(5,502,837)
(191,202)
(73,273)
(262,998)
(5,045,040)
(5,045,040)
Net cash used in financing activities
(4,881,311)
(4,739,079)
NET DECREASE IN CASH AND CASH EQUIVALENTS
Cash and cash equivalents at 1 January
Net foreign exchange differences
(378,328)
(380,886)
(2,310)
(2,993,941)
2,608,676
4,379
CASH AND CASH EQUIVALENTS AT 31 DECEMBER
15
(761,524)
(380,886)
Non-cash items excluded from the statement of cash flows:
Transitional adjustment to lease liabilities on adoption of IFRS 16
Transitional adjustment to property and equipment on adoption of IFRS 16
812,335
(812,335)
Transitional adjustment to retained earnings on adoption of IFRS 9
Transitional adjustment to accounts receivable and other assets on adoption of
2,825,199
IFRS 9
(2,825,199)
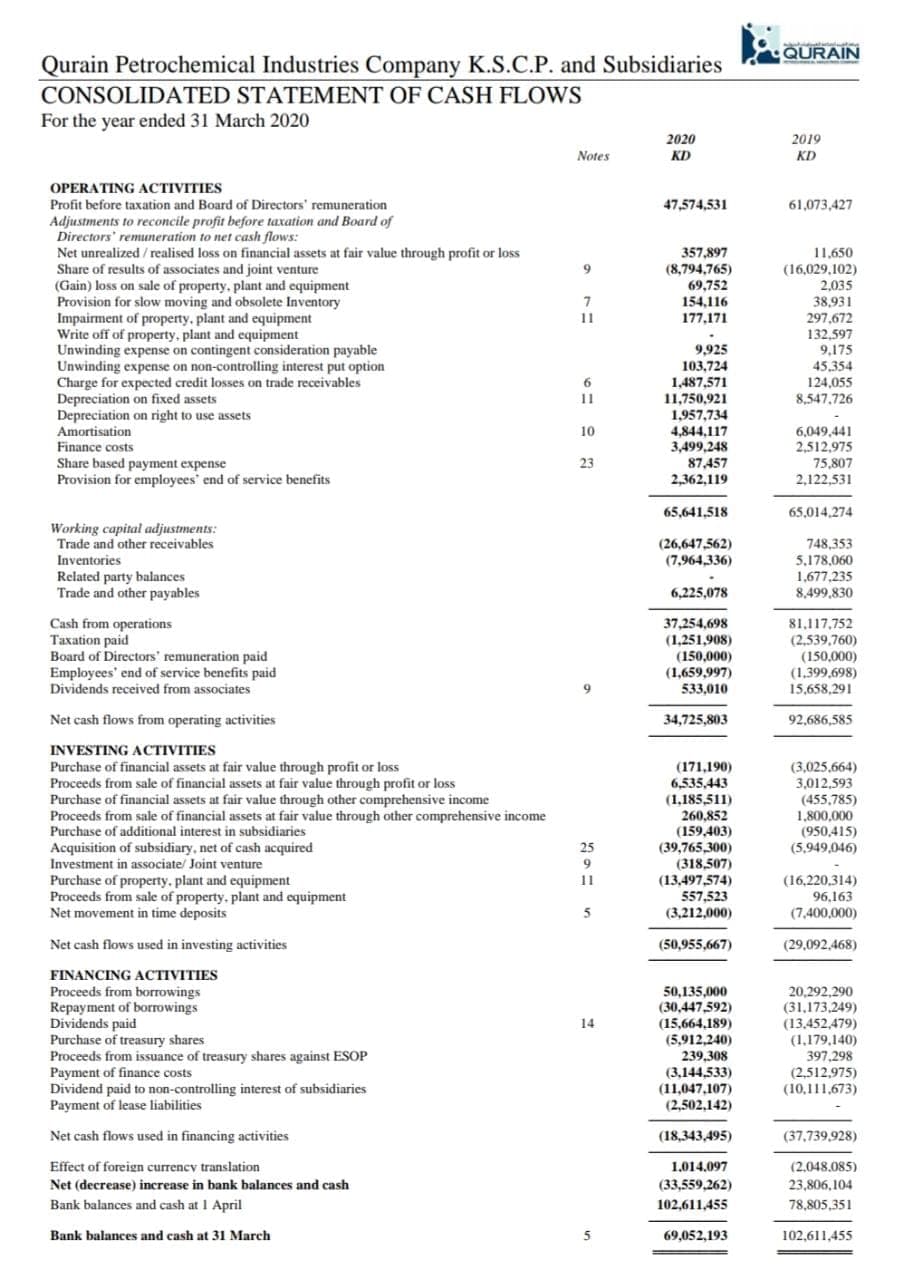
Transcribed Image Text:QURAIN
Qurain Petrochemical Industries Company K.S.C.P. and Subsidiaries
CONSOLIDATED STATEMENT OF CASH FLOWS
For the year ended 31 March 2020
2020
2019
Notes
KD
KD
OPERATING ACTIVITIES
Profit before taxation and Board of Directors' remuneration
47,574,531
61,073,427
Adjustments to reconcile profit before taxation and Board of
Directors' remuneration to net cash flows:
Net unrealized / realised loss on financial assets at fair value through profit or loss
Share of results of associates and joint venture
(Gain) loss on sale of property, plant and equipment
357,897
(8,794,765)
11.650
(16,029,102)
2,035
38,931
9.
Provision for slow moving and obsolete Inventory
Impairment of property, plant and equipment
69,752
154,116
177,171
11
297.672
Write off of property, plant and equipment
White
Unwinding expense on contingent consideration payable
132.597
9,925
103,724
1,487,571
11,750,921
1,957,734
4,844,117
3,499,248
87,457
2.362,119
Unwinding
Charge for expected credit losses on trade receivables
9,175
45.354
124,055
8,547,726
expense on non-controlling interest put option
6.
Depreciation on
Depreciation on right to use assets
Amortisation
fixed assets
11
10
6,049,441
2,512,975
75,807
2,122,531
Finance costs
Share based payment expense
Provision for employees' end of service benefits
23
65,641,518
65,014,274
Working capital adjustments:
Trade and other receivables
(26,647,562)
(7,964,336)
748,353
5,178,060
1,677,235
8,499,830
Inventories
Related party balances
Trade and other payables
6,225,078
Cash from operations
Taxation paid
Board of Directors' remuneration paid
Employees' end of service benefits paid
Dividends received from associates
37,254,698
81,117,752
(1,251,908)
(150,000)
(2,539,760)
(150,000)
(1,399,698)
15,658,291
(1,659,997)
533,010
Net cash flows from operating activities
34,725,803
92,686,585
INVESTING ACTIVITIES
Purchase of financial assets at fair value through profit or loss
Proceeds from sale of financial assets at fair value through profit or loss
Purchase of financial assets at fair value through other comprehensive income
Proceeds from sale of financial assets at fair value through other comprehensive income
Purchase
Acquisition of subsidiary, net of cash acquired
Investment in associate/ Joint venture
(171,190)
6,535,443
(1,185,511)
(3,025.664)
3,012,593
(455,785)
1,800,000
(950,415)
(5,949,046)
260,852
(159,403)
(39,765,300)
(318,507)
(13,497,574)
557,523
(3,212,000)
e of additional interest in subsidiaries
25
9.
Purchase of property, plant and equipment
Proceeds from sale of property, plant and equipment
Net movement in time deposits
11
(16,220,314)
96,163
5
(7,400,000)
Net cash flows used in investing activities
(50,955,667)
(29,092,468)
FINANCING ACTIVITIES
Proceeds from borrowings
Repayment of borrowings
Dividends
Purchase of treasury shares
Proceeds from issuance of treasury shares against ESOP
Payment of finance costs
Dividend paid to non-controlling interest of subsidiaries
Payment of lease liabilities
50,135,000
(30,447,592)
(15,664,189)
20,292,290
(31,173,249)
(13,452,479)
(1,179,140)
397.298
(2,512,975)
(10,111,673)
paid
14
(5,912,240)
239,308
(3,144,533)
(11,047,107)
(2,502,142)
Net cash flows used in financing activities
(18,343,495)
(37,739,928)
1.014.097
(33,559,262)
Effect of foreign currency translation
(2,048.085)
Net (decrease) increase in bank balances and cash
23,806,104
Bank balances and cash at 1 April
102,611,455
78,805,351
Bank balances and cash at 31 March
5
69,052,193
102,611,455
Expert Solution
This question has been solved!
Explore an expertly crafted, step-by-step solution for a thorough understanding of key concepts.

Step by step
Solved in 2 steps

Knowledge Booster


Learn more about
Need a deep-dive on the concept behind this application? Look no further. Learn more about this topic, accounting and related others by exploring similar questions and additional content below.Recommended textbooks for you
Financial Accounting: The Impact on Decision Make…
Accounting
ISBN:
9781305654174
Author:
Gary A. Porter, Curtis L. Norton
Publisher:
Cengage Learning

Financial Reporting, Financial Statement Analysis…
Finance
ISBN:
9781285190907
Author:
James M. Wahlen, Stephen P. Baginski, Mark Bradshaw
Publisher:
Cengage Learning

Cornerstones of Financial Accounting
Accounting
ISBN:
9781337690881
Author:
Jay Rich, Jeff Jones
Publisher:
Cengage Learning
Financial Accounting: The Impact on Decision Make…
Accounting
ISBN:
9781305654174
Author:
Gary A. Porter, Curtis L. Norton
Publisher:
Cengage Learning
Financial Reporting, Financial Statement Analysis…
Finance
ISBN:
9781285190907
Author:
James M. Wahlen, Stephen P. Baginski, Mark Bradshaw
Publisher:
Cengage Learning
Cornerstones of Financial Accounting
Accounting
ISBN:
9781337690881
Author:
Jay Rich, Jeff Jones
Publisher:
Cengage Learning

Intermediate Accounting: Reporting And Analysis
Accounting
ISBN:
9781337788281
Author:
James M. Wahlen, Jefferson P. Jones, Donald Pagach
Publisher:
Cengage Learning

Fundamentals Of Financial Management, Concise Edi…
Finance
ISBN:
9781337902571
Author:
Eugene F. Brigham, Joel F. Houston
Publisher:
Cengage Learning
