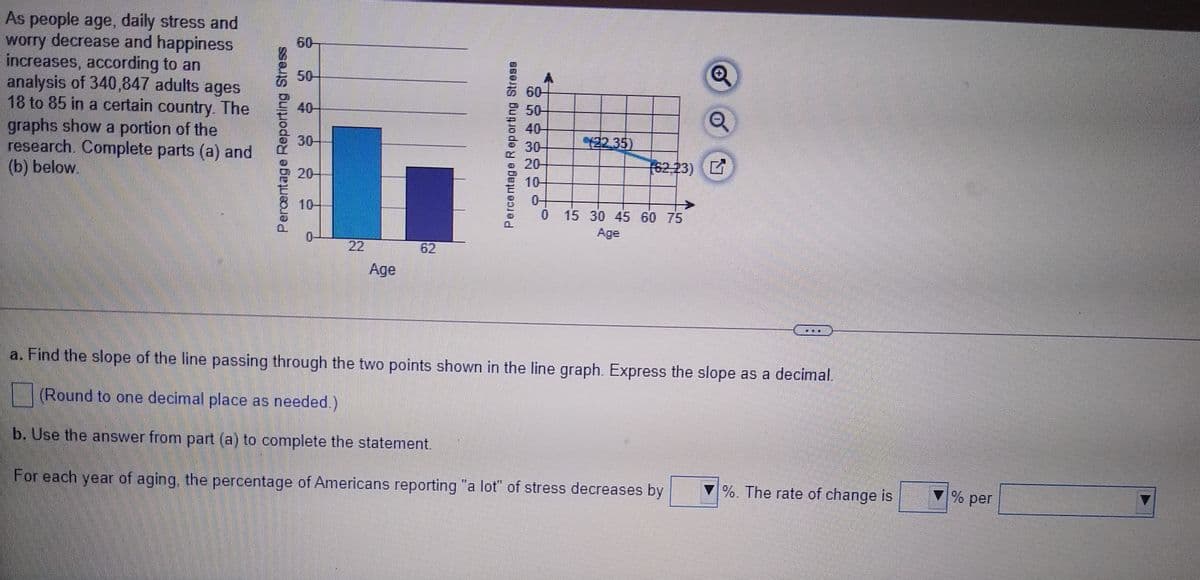
As people age, daily stress and worry decrease and happiness increases, according to an analysis of 340,847 adults ages 18 to 85 in a certain country. The graphs show a portion of the research. Complete parts (a) and (b) below. 60- 50- * 60- 2 50- 5 40- E 30- 40- 30- 22.35) 20- 76223) C 20- 10- 0- 15 30 45 60 75 10- Age 0- 22 62 Age a. Find the slope of the line passing through the two points shown in the line graph. Express the slope as a decimal. (Round to one decimal place as needed.) b. Use the answer from part (a) to complete the statement. For each year of aging, the percentage of Americans reporting "a lot" of stress decreases by %. The rate of change is % per Percentage Reporting Stress Percentage R ep orting Stress
As people age, daily stress and worry decrease and happiness increases, according to an analysis of 340,847 adults ages 18 to 85 in a certain country. The graphs show a portion of the research. Complete parts (a) and (b) below. 60- 50- * 60- 2 50- 5 40- E 30- 40- 30- 22.35) 20- 76223) C 20- 10- 0- 15 30 45 60 75 10- Age 0- 22 62 Age a. Find the slope of the line passing through the two points shown in the line graph. Express the slope as a decimal. (Round to one decimal place as needed.) b. Use the answer from part (a) to complete the statement. For each year of aging, the percentage of Americans reporting "a lot" of stress decreases by %. The rate of change is % per Percentage Reporting Stress Percentage R ep orting Stress

Chapter9: Sequences, Probability And Counting Theory
Section9.5: Counting Principles
Problem 36SE: The number of 5-element subsets from a set containing n elements is equal to the number of 6-element...

Related questions
Question
Transcribed Image Text:As people age, daily stress and
worry decrease and happiness
increases, according to an
analysis of 340,847 adults ages
18 to 85 in a certain country. The
graphs show a portion of the
research. Complete parts (a) and
(b) below.
60-
50-
あ 60-
巴 50
40-
40
30-
30
422 35)
20-
(62,23)
20-
10-
0-
10-
0.
0 15 30 45 60 75
Age
22
62
Age
a. Find the slope of the line passing through the two points shown in the line graph. Express the slope as a decimal.
(Round to one decimal place as needed.)
b. Use the answer from part (a) to complete the statement.
For each year of aging, the percentage of Americans reporting "a lot" of stress decreases by
▼%. The rate of change is
V% per
Percentage Reporting Stress
Percentage Reporting Stress
Expert Solution
This question has been solved!
Explore an expertly crafted, step-by-step solution for a thorough understanding of key concepts.

This is a popular solution!

Trending now
This is a popular solution!

Step by step
Solved in 2 steps with 2 images

Recommended textbooks for you

Algebra & Trigonometry with Analytic Geometry
Algebra
ISBN:
9781133382119
Author:
Swokowski
Publisher:
Cengage

Elementary Linear Algebra (MindTap Course List)
Algebra
ISBN:
9781305658004
Author:
Ron Larson
Publisher:
Cengage Learning
Algebra & Trigonometry with Analytic Geometry
Algebra
ISBN:
9781133382119
Author:
Swokowski
Publisher:
Cengage
Elementary Linear Algebra (MindTap Course List)
Algebra
ISBN:
9781305658004
Author:
Ron Larson
Publisher:
Cengage Learning