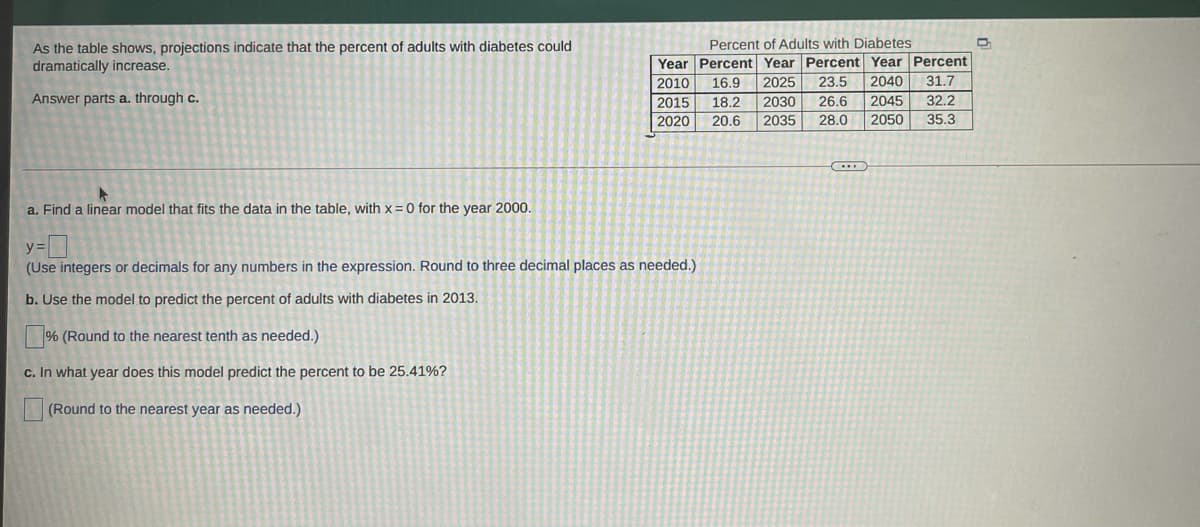
As the table shows, projections indicate that the percent of adults with diabetes could dramatically increase. Percent of Adults with Diabetes Year Percent Year Percent Year Percent 2010 16.9 2025 23.5 2040 31.7 Answer parts a. through c. 2015 18.2 2030 26.6 2045 32.2 2020 20.6 2035 28.0 2050 35.3 a. Find a linear model that fits the data in the table, with x = 0 for the year 2000. y% = (Use integers or decimals for any numbers in the expression. Round to three decimal places as needed.) b. Use the model to predict the percent of adults with diabetes in 2013. % (Round to the nearest tenth as needed.) c. In what year does this model predict the percent to be 25.41%? (Round to the nearest year as needed.)
As the table shows, projections indicate that the percent of adults with diabetes could dramatically increase. Percent of Adults with Diabetes Year Percent Year Percent Year Percent 2010 16.9 2025 23.5 2040 31.7 Answer parts a. through c. 2015 18.2 2030 26.6 2045 32.2 2020 20.6 2035 28.0 2050 35.3 a. Find a linear model that fits the data in the table, with x = 0 for the year 2000. y% = (Use integers or decimals for any numbers in the expression. Round to three decimal places as needed.) b. Use the model to predict the percent of adults with diabetes in 2013. % (Round to the nearest tenth as needed.) c. In what year does this model predict the percent to be 25.41%? (Round to the nearest year as needed.)

Algebra & Trigonometry with Analytic Geometry
13th Edition
ISBN:9781133382119
Author:Swokowski
Publisher:Swokowski
Chapter7: Analytic Trigonometry
Section7.6: The Inverse Trigonometric Functions
Problem 91E

Related questions
Question
Transcribed Image Text:As the table shows, projections indicate that the percent of adults with diabetes could
dramatically increase.
Percent of Adults with Diabetes
Year Percent Year Percent Year Percent
2010
16.9
2025
23.5
2040
31.7
Answer parts a. through c.
2015
18.2
2030
26.6
2045
32.2
2020
20.6
2035
28.0
2050
35.3
a. Find a linear model that fits the data in the table, with x = 0 for the year 2000.
(Use integers or decimals for any numbers in the expression. Round to three decimal places as needed.)
b. Use the model to predict the percent of adults with diabetes in 2013.
% (Round to the nearest tenth as needed.)
c. In what year does this model predict the percent to be 25.41%?
(Round to the nearest year as needed.)
Expert Solution
This question has been solved!
Explore an expertly crafted, step-by-step solution for a thorough understanding of key concepts.

This is a popular solution!

Trending now
This is a popular solution!

Step by step
Solved in 4 steps with 3 images

Recommended textbooks for you
Algebra & Trigonometry with Analytic Geometry
Algebra
ISBN:
9781133382119
Author:
Swokowski
Publisher:
Cengage

Algebra and Trigonometry (MindTap Course List)
Algebra
ISBN:
9781305071742
Author:
James Stewart, Lothar Redlin, Saleem Watson
Publisher:
Cengage Learning

Algebra & Trigonometry with Analytic Geometry
Algebra
ISBN:
9781133382119
Author:
Swokowski
Publisher:
Cengage
Algebra and Trigonometry (MindTap Course List)
Algebra
ISBN:
9781305071742
Author:
James Stewart, Lothar Redlin, Saleem Watson
Publisher:
Cengage Learning

Functions and Change: A Modeling Approach to Coll…
Algebra
ISBN:
9781337111348
Author:
Bruce Crauder, Benny Evans, Alan Noell
Publisher:
Cengage Learning