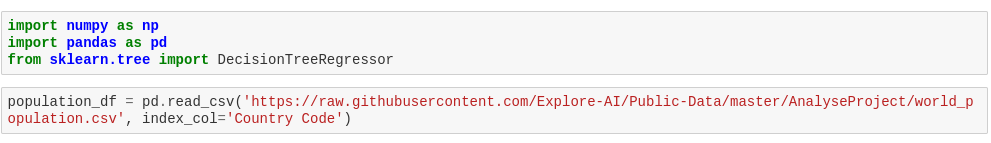
The world population data spans from 1960 to 2017. We'd like to build a predictive model that can give us the best guess at what the population growth rate in a given year might be. We will calculate the population growth rate as follows:- Growth_rate=current_year_population−previous_year_populationprevious_year_population As such, we can only calculate the growth rate for the year 1961 onwards. Write a function that takes the population_df and a country_code as input and computes the population growth rate for a given country starting from the year 1961. This function must return a return a 2-d numpy array that contains the year and corresponding growth rate for the country. Function Specifications: Should take a population_df and country_code string as input and return a numpy array as output. The array should only have two columns containing the year and the population growth rate, in other words, it should have a shape (?, 2) where ? is the length of the data. def get_population_growth_rate_by_country_year(df,country_code):


Question 1:
a)Population Growth
The world population data spans from 1960 to 2017. We'd like to build a predictive model that can give us the best guess at what the population growth rate in a given year might be. We will calculate the population growth rate as follows:-
As such, we can only calculate the growth rate for the year 1961 onwards.
Write a function that takes the population_df and a country_code as input and computes the population growth rate for a given country starting from the year 1961. This function must return a return a 2-d numpy array that contains the year and corresponding growth rate for the country.
Function Specifications:
- Should take a population_df and country_code string as input and return a numpy array as output.
- The array should only have two columns containing the year and the population growth rate, in other words, it should have a shape (?, 2) where ? is the length of the data.
b)Even-Odd Train-Test Split
Now that we have have our data, we need to split this into a set of variables we will be training on, and the set of variables that we will make our predictions on. In this case, we're splitting the values such that the training set consists of growth rates for even years and the test consists of growth rates for odd years. We also need to split our data into the predictive features (denoted X) and the response (denoted y).
Write a function that will take as input a 2-d numpy array and return four variables in the form of (X_train, y_train), (X_test, y_test), where (X_train, y_train) are the features / response of the training set, and (X-test, y_test) are the feautes / response of the testing set where the training and testing data consists of even and odd years respectively:
Function Specifications:
- Should take a 2-d numpy array as input.
- Should return two tuples of the form (X_train, y_train), (X_test, y_test).
- (X_train, y_train) should consist of data from even years and (X_test, y_test) should consist of data from odd years.
c)
Now that we have formatted our data, we can fit a model using sklearn's DecisionTreeRegressor class. We'll write a function that will take as input the features and response variables that we created in the last question, and return a trained model.
Function Specifications:
- Should take two numpy arrays as input in the form (X_train, y_train) as well as a MaxDepth int corresponding to the max_depth hyperparameter in decision trees.
- Should return an sklearn DecisionTreeRegressor model.
- The returned model should be fitted to the data.
Hint: You may need to reshape the data within the function. You can use .reshape(-1, 1) to do this.
![We would now like to test on our testing data that we produced from Question 2. This test will give the Root Mean Squared Logarithmic Error (RMSLE),
which is given by:
RMSLE =
[log(1+ p:) – log(1+ yi)]?
where p; refers to the ith prediction made from X_test , Y; refers to the ith value in y_test , and N is the length of y_test .
Function Specifications:
• Should take a trained model and two arrays as input. This will be the X_test and y_test variables from Question 2.
• Should return the Root Mean Squared Logarithmic Error (RMSLE) over the input from the predicted values of X_test as compared to values of
y_test.
• The output should be a float rounded to 3 decimal places.
### START FUNCTION
def test_model(model, y_test, X_test):](/v2/_next/image?url=https%3A%2F%2Fcontent.bartleby.com%2Fqna-images%2Fquestion%2F57895fb0-dee3-4f4d-8c4c-52e536059d25%2Fceddf7a8-c009-4c36-b1c5-6af467737b4e%2F9y8whx_processed.png&w=3840&q=75)


Trending now
This is a popular solution!

Step by step
Solved in 2 steps

As we've seen previously, the world population data spans from 1960 to 2017. We'd like to build a predictive model that can give us the best guess at what the world population in a given year was. However, as a slight twist this time, we want to compute this estimate for only countries within a given income group.
First, however, we need to organise our data such that the sklearn's RandomForestRegressor class can train on our data. To do this, we will write a function that takes as input an income group and return a 2-d numpy array that contains the year and the measured population.
Function Specifications:
- Should take a str argument, called income_group_name as input and return a numpy array type as output.
- Set the default argument of income_group_name to equal 'Low income'.
- If the specified value of income_group_name does not exist, the function must raise a ValueError.
- The array should only have two columns containing the year and the population, in other words, it should have a shape (?, 2) where ? is the length of the data.
- The values within the array should be of type np.int64.
Further Reading:
Data types are associated with memory allocation. As such, your choice of data type affects the precision of computations in your program. For example, the np.int data type in numpy can only store values between -2147483648 to 2147483647 and assigning values outside this range for variables of this data type may cause run-time errors. To avoid this, we can use data types with larger memory capacity e.g. np.int64.
https://docs.scipy.org/doc/numpy/user/basics.types.html


