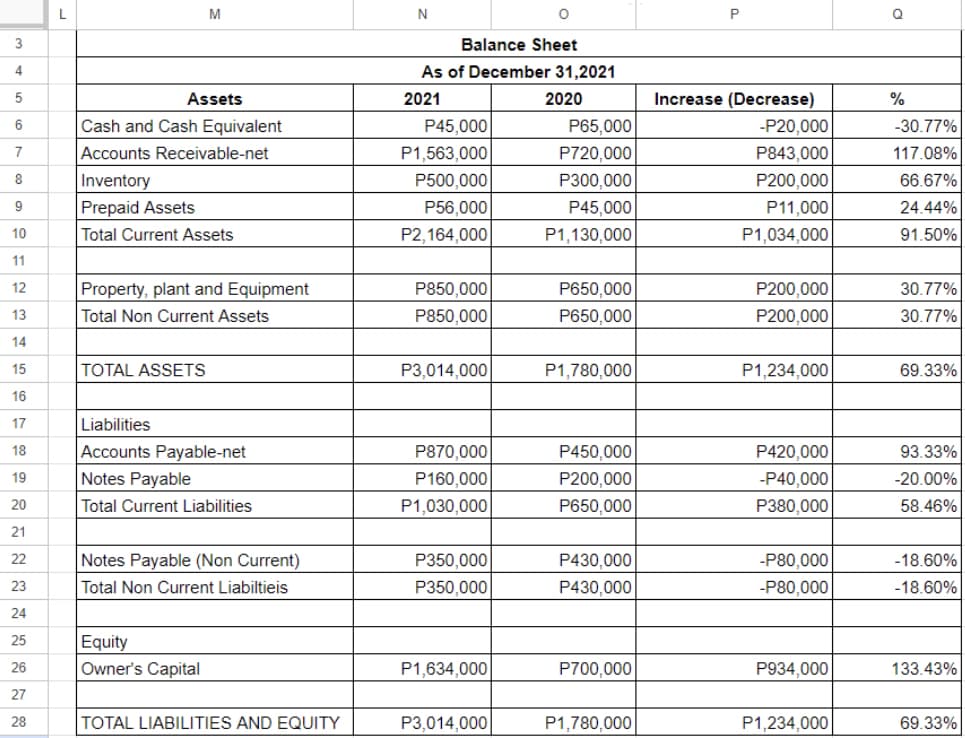
Assets Cash and Cash Equivalent Accounts Receivable-net Inventory Prepaid Assets Total Current Assets Property, plant and Equipment Total Non Current Assets TOTAL ASSETS Liabilities Accounts Payable-net Notes Payable Total Current Liabilities Notes Payable (Non Current) Total Non Current Liabiltieis Equity Owner's Capital TOTAL LIABILITIES AND EQUITY Balance Sheet As of December 31,2021 2021 2020 P45,000 P1,563,000 P500,000 P56,000 P2,164,000 P850,000 P850,000 P3,014,000 P870,000 P160,000 P1,030,000 P350,000 P350,000 P1,634,000 P3,014,000 P65,000 P720,000 P300,000 P45,000 P1,130,000 P650,000 P650,000 P1,780,000 P450,000 P200,000 P650,000 P430,000 P430,000 P700,000 P1,780,000 Increase (Decrease) -P20,000 P843,000 P200,000 P11,000 P1,034,000 P200,000 P200,000 P1,234,000 P420,000 -P40,000 P380,000 -P80,000 -P80,000 P934,000 P1,234,000 % -30.77% 117.08% 66.67% 24.44% 91.50% 30.77% 30.77% 69.33% 93.33% -20.00% 58.46% -18.60% -18.60% 133.43% 69.33%
Reporting Cash Flows
Reporting of cash flows means a statement of cash flow which is a financial statement. A cash flow statement is prepared by gathering all the data regarding inflows and outflows of a company. The cash flow statement includes cash inflows and outflows from various activities such as operating, financing, and investment. Reporting this statement is important because it is the main financial statement of the company.
Balance Sheet
A balance sheet is an integral part of the set of financial statements of an organization that reports the assets, liabilities, equity (shareholding) capital, other short and long-term debts, along with other related items. A balance sheet is one of the most critical measures of the financial performance and position of the company, and as the name suggests, the statement must balance the assets against the liabilities and equity. The assets are what the company owns, and the liabilities represent what the company owes. Equity represents the amount invested in the business, either by the promoters of the company or by external shareholders. The total assets must match total liabilities plus equity.
Financial Statements
Financial statements are written records of an organization which provide a true and real picture of business activities. It shows the financial position and the operating performance of the company. It is prepared at the end of every financial cycle. It includes three main components that are balance sheet, income statement and cash flow statement.
Owner's Capital
Before we begin to understand what Owner’s capital is and what Equity financing is to an organization, it is important to understand some basic accounting terminologies. A double-entry bookkeeping system Normal account balances are those which are expected to have either a debit balance or a credit balance, depending on the nature of the account. An asset account will have a debit balance as normal balance because an asset is a debit account. Similarly, a liability account will have the normal balance as a credit balance because it is amount owed, representing a credit account. Equity is also said to have a credit balance as its normal balance. However, sometimes the normal balances may be reversed, often due to incorrect journal or posting entries or other accounting/ clerical errors.


Step by step
Solved in 4 steps


