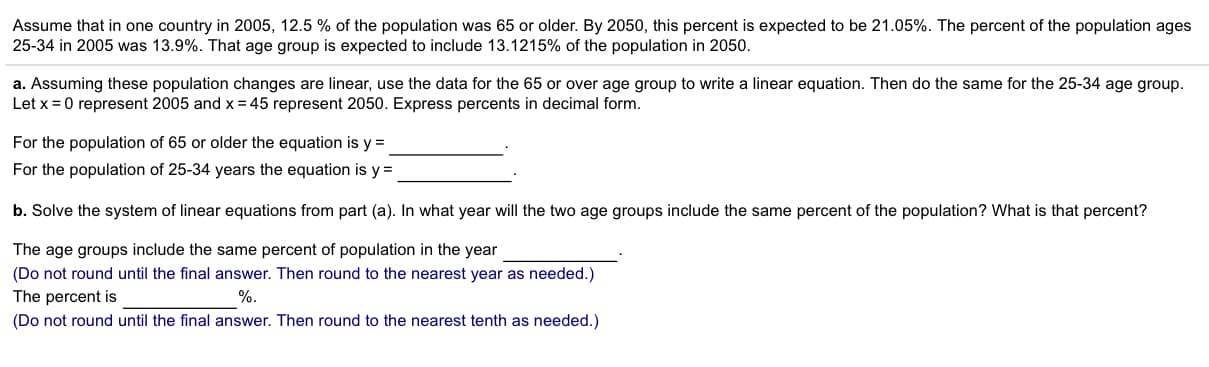
Assume that in one country in 2005, 12.5 % of the population was 65 or older. By 2050, this percent is expected to be 21.05%. The percent of the population ages 25-34 in 2005 was 13.9%. That age group is expected to include 13.1215% of the population in 2050 a. Assuming these population changes are linear, use the data for the 65 or over age group to write a linear equation. Then do the same for the 25-34 age group. Let x 0 represent 2005 and x= 45 represent 2050. Express percents in decimal form. For the population of 65 or older the equation is y = For the population of 25-34 years the equation is y b. Solve the system of linear equations from part (a). In what year will the two age groups include the same percent of the population? What is that percent? The age groups include the same percent of population in the year (Do not round until the final answer. Then round to the nearest year as needed.) The percent is (Do not round until the final answer. Then round to the nearest tenth as needed.)


Compound Probability
Compound probability can be defined as the probability of the two events which are independent. It can be defined as the multiplication of the probability of two events that are not dependent.
Tree diagram
Probability theory is a branch of mathematics that deals with the subject of probability. Although there are many different concepts of probability, probability theory expresses the definition mathematically through a series of axioms. Usually, these axioms express probability in terms of a probability space, which assigns a measure with values ranging from 0 to 1 to a set of outcomes known as the sample space. An event is a subset of these outcomes that is described.
Conditional Probability
By definition, the term probability is expressed as a part of mathematics where the chance of an event that may either occur or not is evaluated and expressed in numerical terms. The range of the value within which probability can be expressed is between 0 and 1. The higher the chance of an event occurring, the closer is its value to be 1. If the probability of an event is 1, it means that the event will happen under all considered circumstances. Similarly, if the probability is exactly 0, then no matter the situation, the event will never occur.
represent 2005 and x=45 represent 2050. Express percents in decimal form.
B2.) The percent is_______%.


Trending now
This is a popular solution!

Step by step
Solved in 4 steps with 4 images


