Assuming the original 10 organisms grew exponentially, doubling in size with every unit of time, calculate the population size from t0 to t4 and draw the position of this curve on your graph. Adjust your figure legend.
Assuming the original 10 organisms grew exponentially, doubling in size with every unit of time, calculate the population size from t0 to t4 and draw the position of this curve on your graph. Adjust your figure legend.

Concepts of Biology
1st Edition
ISBN:9781938168116
Author:Samantha Fowler, Rebecca Roush, James Wise
Publisher:Samantha Fowler, Rebecca Roush, James Wise
Chapter19: Population And Community Ecology
Section: Chapter Questions
Problem 5RQ: Which of the following is best at showing the life expectancy of an individual within a population?...

Related questions
Question
- Assuming the original 10 organisms grew exponentially, doubling in size with every unit of time, calculate the
population size from t0 to t4 and draw the position of this curve on your graph. Adjust your figure legend.
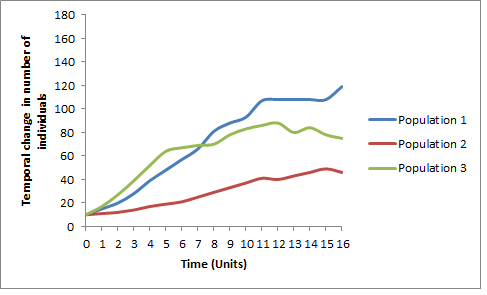
Transcribed Image Text:180
160
140
120
100
-Population 1
80
-Populat ion 2
60
-Populat ion 3
40
20
0 1 2 3 4 5 6 7 8 9 1011 12 131415 16
Time (Units)
Temporal change in number of
individuak
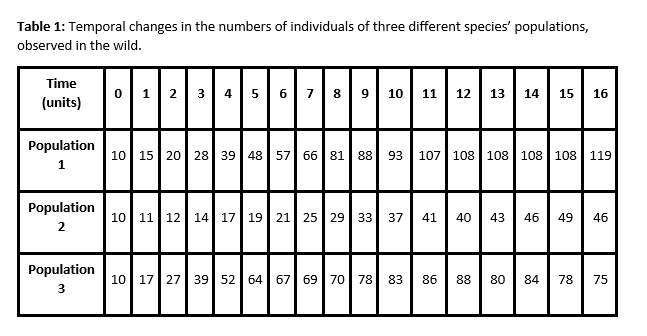
Transcribed Image Text:Table 1: Temporal changes in the numbers of individuals of three different species' populations,
observed in the wild.
Time
0| 1
2 3 45 6789 10
9| 10| 11
12
13
14
15
16
(units)
Population
10
15 20 28 39 48 57 66 81 | 88
107 108 108 108 108 119
93
1.
Population
10| 11| 12
14 17 19
21 25 29| 33
37
41
40
43
46
49
46
Population
10| 17| 27
39 52 64
67 69| 70 78
83
86
88
80
84
78
75
Expert Solution
This question has been solved!
Explore an expertly crafted, step-by-step solution for a thorough understanding of key concepts.

Step by step
Solved in 2 steps with 1 images

Recommended textbooks for you
Concepts of Biology
Biology
ISBN:
9781938168116
Author:
Samantha Fowler, Rebecca Roush, James Wise
Publisher:
OpenStax College
Concepts of Biology
Biology
ISBN:
9781938168116
Author:
Samantha Fowler, Rebecca Roush, James Wise
Publisher:
OpenStax College