At noon, ship A was 16 nautical miles due north of ship B. Ship A was sailing south at 16 knots (nautical miles per hour; a nautical mile is 2000 yd) and continued to do all day. Ship B was sailing east at 11 knots and continued to do so all day. Complete parts (a) through (e) below. a. Start counting time with t=0 at noon and express the distances between the ships as a function of t. s(t) = b. How rapidly was the distance between the ships changing at noon? One hour later? At noon the distance between the ships was changing at a rate of One hour later, the distance between the ships was changing at a rate of c. The visibility that day was 5 nautical miles. Did the ships ever sight each other? O No OYes ds d. Graph s and together as functions of t for 1st≤ 3. Compare the graphs and reconcile what you see with your answers in parts (b) and (c). Select the correct
At noon, ship A was 16 nautical miles due north of ship B. Ship A was sailing south at 16 knots (nautical miles per hour; a nautical mile is 2000 yd) and continued to do all day. Ship B was sailing east at 11 knots and continued to do so all day. Complete parts (a) through (e) below. a. Start counting time with t=0 at noon and express the distances between the ships as a function of t. s(t) = b. How rapidly was the distance between the ships changing at noon? One hour later? At noon the distance between the ships was changing at a rate of One hour later, the distance between the ships was changing at a rate of c. The visibility that day was 5 nautical miles. Did the ships ever sight each other? O No OYes ds d. Graph s and together as functions of t for 1st≤ 3. Compare the graphs and reconcile what you see with your answers in parts (b) and (c). Select the correct

Algebra & Trigonometry with Analytic Geometry
13th Edition
ISBN:9781133382119
Author:Swokowski
Publisher:Swokowski
Chapter6: The Trigonometric Functions
Section6.5: Trigonometric Graphs
Problem 57E

Related questions
Question
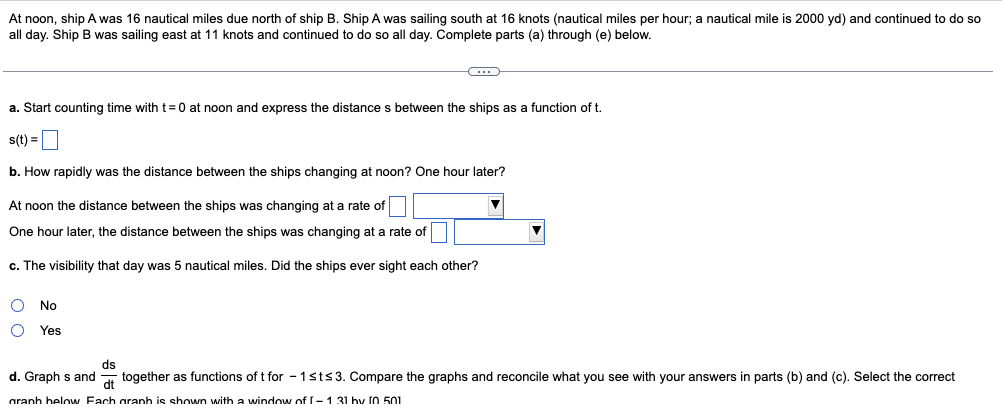
Transcribed Image Text:At noon, ship A was 16 nautical miles due north of ship B. Ship A was sailing south at 16 knots (nautical miles per hour; a nautical mile is 2000 yd) and continued to do so
all day. Ship B was sailing east at 11 knots and continued to do so all day. Complete parts (a) through (e) below.
C...
a. Start counting time with t=0 at noon and express the distances between the ships as a function of t.
s(t) =
b. How rapidly was the distance between the ships changing at noon? One hour later?
At noon the distance between the ships was changing at a rate of
One hour later, the distance between the ships was changing at a rate of
c. The visibility that day was 5 nautical miles. Did the ships ever sight each other?
No
O Yes
ds
d. Graphs and together as functions of t for - 1 st≤3. Compare the graphs and reconcile what you see with your answers in parts (b) and (c). Select the correct
granh helow Fach graph is shown with a window of I-1 31 bv 10 501
![ds
d. Graph s and together as functions of t for 1 st≤3. Compare the graphs and reconcile what you see with your answers in parts (b) and (c). Select the correct
dt
graph below. Each graph is shown with a window of [-1,3] by [0,50].
O A.
x
Q
✔
OB.
O C.
Q
11.4
O D.
KA
Q
Q
✓
ds
ds
dt
e. The graph of looks as if it might have a horizontal asymptote in the first quadrant. This in turn suggests that approaches a limiting value as t→∞o. What is this
dt
value? What is its relations to the ships' individual speeds? Select the correct answer below and fill in the answer box to complete your choice.
(Type an exact answer, using radicals as needed.)
OA. The limit is . This limit is the square root of the differences of the squares of the individual speeds.
OB The limit is This limit is the square root of the sums of the squares of the individual speeds](/v2/_next/image?url=https%3A%2F%2Fcontent.bartleby.com%2Fqna-images%2Fquestion%2F03550233-2e08-4359-86bb-8bc56804e45a%2Fb922c572-1106-4cf9-8709-8af8bd8efc49%2Fcuvxds_processed.png&w=3840&q=75)
Transcribed Image Text:ds
d. Graph s and together as functions of t for 1 st≤3. Compare the graphs and reconcile what you see with your answers in parts (b) and (c). Select the correct
dt
graph below. Each graph is shown with a window of [-1,3] by [0,50].
O A.
x
Q
✔
OB.
O C.
Q
11.4
O D.
KA
Q
Q
✓
ds
ds
dt
e. The graph of looks as if it might have a horizontal asymptote in the first quadrant. This in turn suggests that approaches a limiting value as t→∞o. What is this
dt
value? What is its relations to the ships' individual speeds? Select the correct answer below and fill in the answer box to complete your choice.
(Type an exact answer, using radicals as needed.)
OA. The limit is . This limit is the square root of the differences of the squares of the individual speeds.
OB The limit is This limit is the square root of the sums of the squares of the individual speeds
Expert Solution
This question has been solved!
Explore an expertly crafted, step-by-step solution for a thorough understanding of key concepts.

Step by step
Solved in 3 steps with 3 images

Recommended textbooks for you
Algebra & Trigonometry with Analytic Geometry
Algebra
ISBN:
9781133382119
Author:
Swokowski
Publisher:
Cengage

Functions and Change: A Modeling Approach to Coll…
Algebra
ISBN:
9781337111348
Author:
Bruce Crauder, Benny Evans, Alan Noell
Publisher:
Cengage Learning

Algebra & Trigonometry with Analytic Geometry
Algebra
ISBN:
9781133382119
Author:
Swokowski
Publisher:
Cengage
Functions and Change: A Modeling Approach to Coll…
Algebra
ISBN:
9781337111348
Author:
Bruce Crauder, Benny Evans, Alan Noell
Publisher:
Cengage Learning

Elementary Linear Algebra (MindTap Course List)
Algebra
ISBN:
9781305658004
Author:
Ron Larson
Publisher:
Cengage Learning