At time t (in days), the size S of a population of butterflies is given by the formula S= 600 1+49(0.6) Use the graph above and your knowledge of derivatives to answer the following: 1. What is the growth rate after 10 days? 2. When does the maximum growth rate occur? 3. Explain why the shape of the graph looks this way. .
At time t (in days), the size S of a population of butterflies is given by the formula S= 600 1+49(0.6) Use the graph above and your knowledge of derivatives to answer the following: 1. What is the growth rate after 10 days? 2. When does the maximum growth rate occur? 3. Explain why the shape of the graph looks this way. .

Elementary Algebra
17th Edition
ISBN:9780998625713
Author:Lynn Marecek, MaryAnne Anthony-Smith
Publisher:Lynn Marecek, MaryAnne Anthony-Smith
Chapter1: Foundations
Section1.4: Multiply And Divide Integers
Problem 1.103TI: Simplify: 12(9)(3)3 .

Related questions
Question
Transcribed Image Text:00+
300-
200-
100-
10

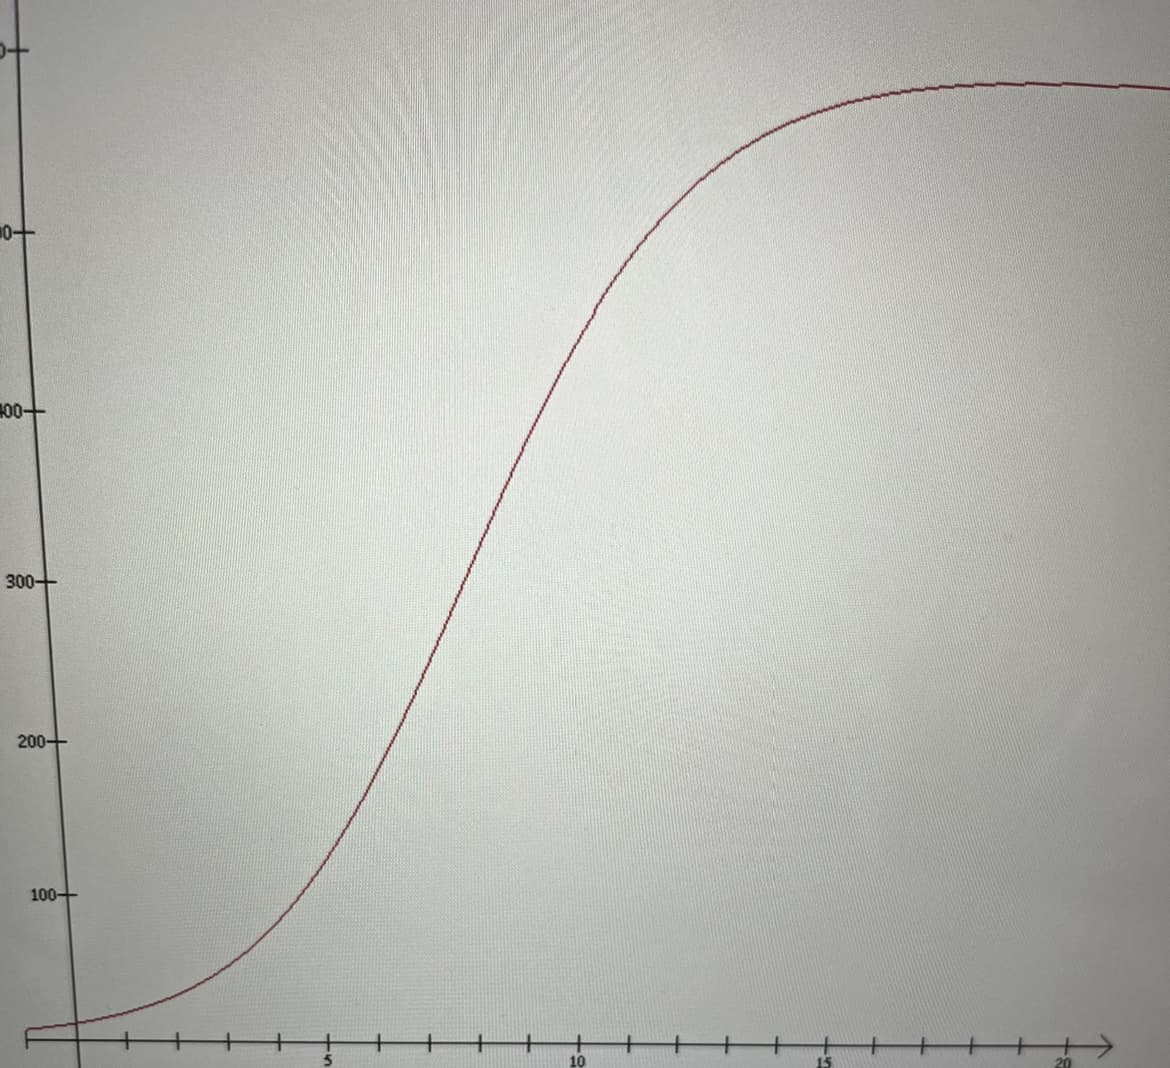
Transcribed Image Text:At time t (in days), the size S of a population of butterflies is given by the formula
600
S=
1+49(0.6)**
Use the graph above and your knowledge of derivatives to answer the following:
1. What is the growth rate after 10 days?
2. When does the maximum growth rate occur?
3. Explain why the shape of the graph looks this way.
Expert Solution
This question has been solved!
Explore an expertly crafted, step-by-step solution for a thorough understanding of key concepts.

Step by step
Solved in 4 steps with 1 images

Recommended textbooks for you
Elementary Algebra
Algebra
ISBN:
9780998625713
Author:
Lynn Marecek, MaryAnne Anthony-Smith
Publisher:
OpenStax - Rice University

Algebra: Structure And Method, Book 1
Algebra
ISBN:
9780395977224
Author:
Richard G. Brown, Mary P. Dolciani, Robert H. Sorgenfrey, William L. Cole
Publisher:
McDougal Littell

Elementary Algebra
Algebra
ISBN:
9780998625713
Author:
Lynn Marecek, MaryAnne Anthony-Smith
Publisher:
OpenStax - Rice University
Algebra: Structure And Method, Book 1
Algebra
ISBN:
9780395977224
Author:
Richard G. Brown, Mary P. Dolciani, Robert H. Sorgenfrey, William L. Cole
Publisher:
McDougal Littell
