(b) Complete the entries in the table to report Ax, Ay, and Ay on the intervals from x = 37 to 47, Ax from x = 47 to 57, and from x= 57 to 67. (Keep in mind that for each additional 10 thousand dollars spent, Three Rivers Boat Company sells 80 more boats.) X, thousands y, boats Ax of dollars Ay Ay sold spent on ads 37 785 10 80 47 865 Correct Correct Correct response: 10 response: 80 response: 8 10 80 8 57 945 Correct Correct Correct response: 10 response: 80 response: 8 10 80 8. Correct 67 1,025 Correct Correct response: 10 response: 80 response: 8 Click on "VERIFY" to move to the next part. (c) Use the pull-down menu to indicate the units. The quantity Ax = 10 Click for List The quantity Ay = 80 Click for List The average rate of change is 8 Click for List Consequently, 1 boat will be sold for every additional Number dollars spent on ads. Click on "VERIFY" to move to the next part. Section Attempt 1 of 1
(b) Complete the entries in the table to report Ax, Ay, and Ay on the intervals from x = 37 to 47, Ax from x = 47 to 57, and from x= 57 to 67. (Keep in mind that for each additional 10 thousand dollars spent, Three Rivers Boat Company sells 80 more boats.) X, thousands y, boats Ax of dollars Ay Ay sold spent on ads 37 785 10 80 47 865 Correct Correct Correct response: 10 response: 80 response: 8 10 80 8 57 945 Correct Correct Correct response: 10 response: 80 response: 8 10 80 8. Correct 67 1,025 Correct Correct response: 10 response: 80 response: 8 Click on "VERIFY" to move to the next part. (c) Use the pull-down menu to indicate the units. The quantity Ax = 10 Click for List The quantity Ay = 80 Click for List The average rate of change is 8 Click for List Consequently, 1 boat will be sold for every additional Number dollars spent on ads. Click on "VERIFY" to move to the next part. Section Attempt 1 of 1

Algebra & Trigonometry with Analytic Geometry
13th Edition
ISBN:9781133382119
Author:Swokowski
Publisher:Swokowski
Chapter10: Sequences, Series, And Probability
Section10.8: Probability
Problem 64E

Related questions

Concept explainers
Contingency Table
A contingency table can be defined as the visual representation of the relationship between two or more categorical variables that can be evaluated and registered. It is a categorical version of the scatterplot, which is used to investigate the linear relationship between two variables. A contingency table is indeed a type of frequency distribution table that displays two variables at the same time.
Binomial Distribution
Binomial is an algebraic expression of the sum or the difference of two terms. Before knowing about binomial distribution, we must know about the binomial theorem.
Topic Video
Question
question c)
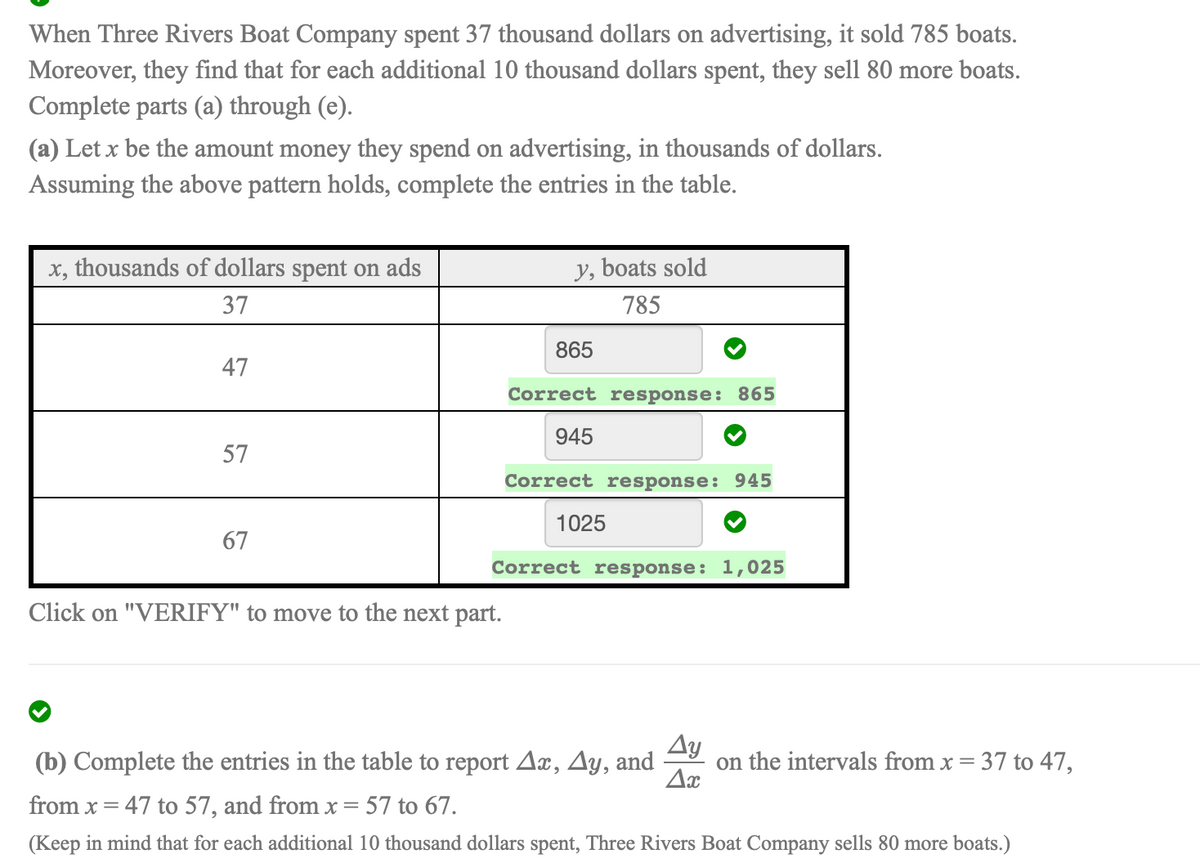
Transcribed Image Text:When Three Rivers Boat Company spent 37 thousand dollars on advertising, it sold 785 boats.
Moreover, they find that for each additional 10 thousand dollars spent, they sell 80 more boats.
Complete parts (a) through (e).
(a) Let x be the amount money they spend on advertising, in thousands of dollars.
Assuming the above pattern holds, complete the entries in the table.
x, thousands of dollars spent on ads
y, boats sold
37
785
865
47
Correct response: 865
945
57
Correct response: 945
1025
67
Correct response: 1,025
Click on "VERIFY" to move to the next part.
(b) Complete the entries in the table to report Ax, Ay, and
Ay
on the intervals from x = 37 to 47,
from x = 47 to 57, and from x
57 to 67.
(Keep in mind that for each additional 10 thousand dollars spent, Three Rivers Boat Company sells 80 more boats.)
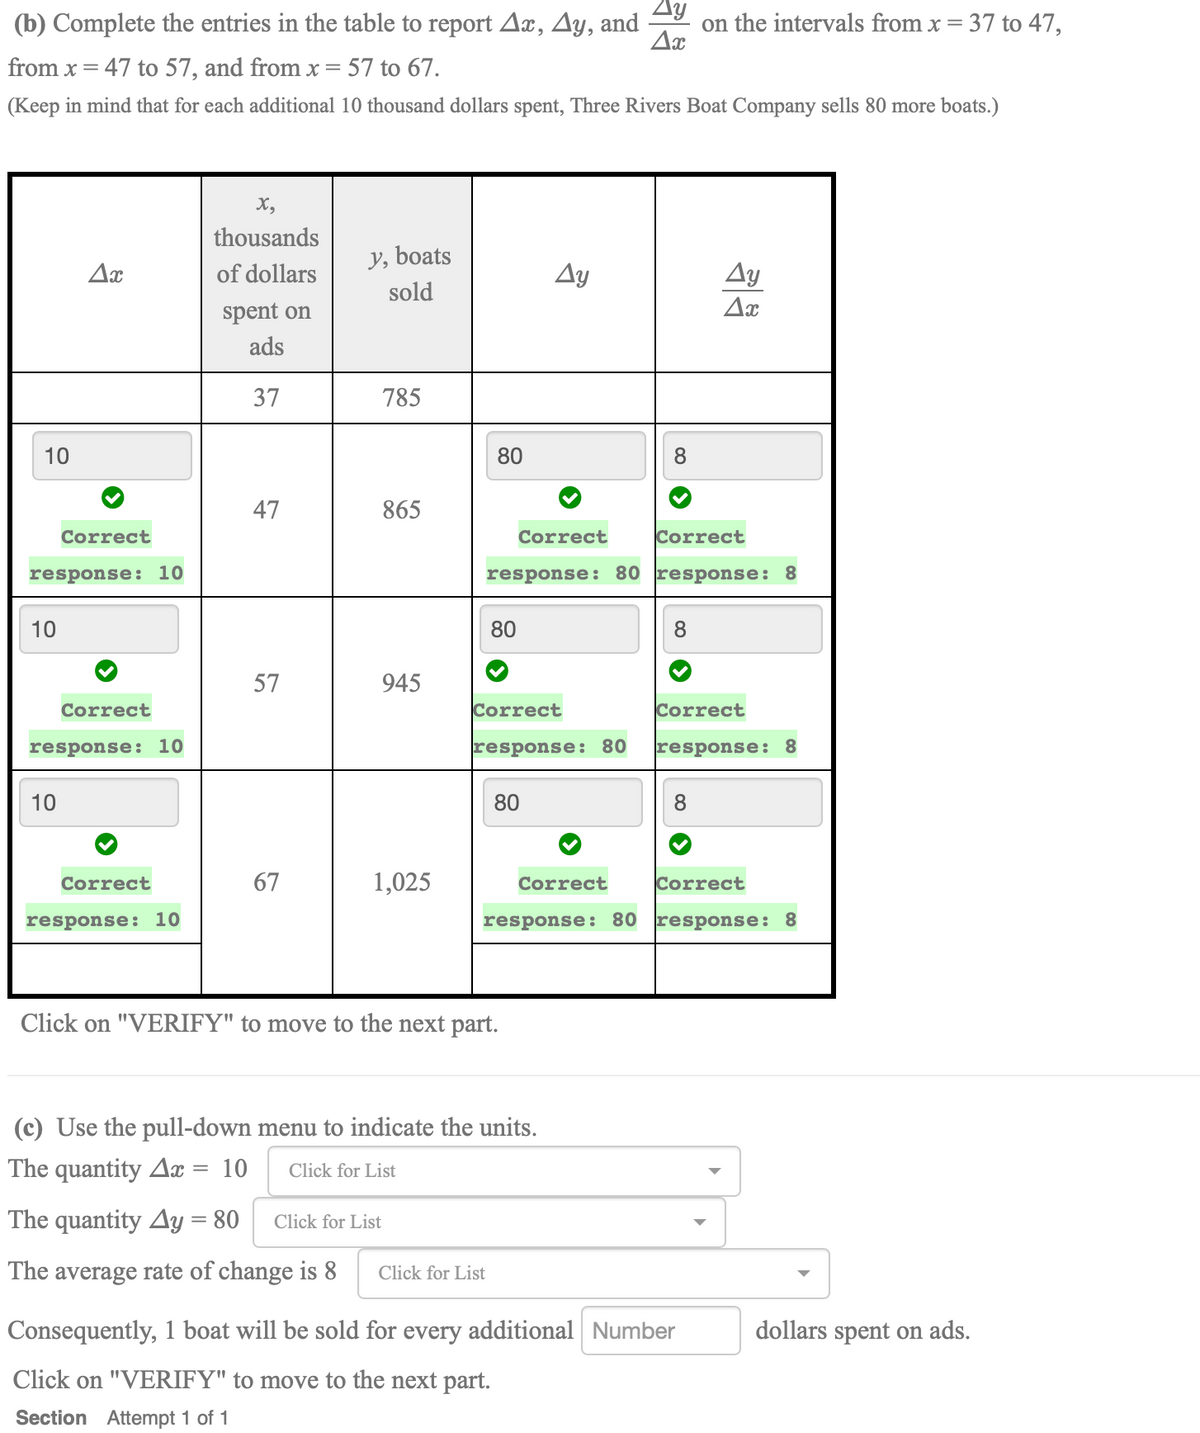
Transcribed Image Text:Ay
(b) Complete the entries in the table to report Ax,
Ay, and
on the intervals from x = 37 to 47,
from x = 47 to 57, and from x = 57 to 67.
(Keep in mind that for each additional 10 thousand dollars spent, Three Rivers Boat Company sells 80 more boats.)
X,
thousands
y, boats
Ax
of dollars
Ay
Ay
sold
spent on
ads
37
785
10
80
47
865
Correct
Correct
Correct
response: 10
response: 80 response: 8
10
80
8
57
945
Correct
Correct
Correct
response: 10
response: 80
response: 8
10
80
8
Correct
67
1,025
Correct
Correct
response: 10
response: 80 response: 8
Click on "VERIFY" to move to the next part.
(c) Use the pull-down menu to indicate the units.
The quantity A = 10
Click for List
The quantity Ay = 80
Click for List
The average rate of change is 8
Click for List
Consequently, 1 boat will be sold for every additional Number
dollars spent on ads.
Click on "VERIFY" to move to the next part.
Section Attempt 1 of 1
Expert Solution
This question has been solved!
Explore an expertly crafted, step-by-step solution for a thorough understanding of key concepts.

Step by step
Solved in 2 steps with 1 images

Knowledge Booster


Learn more about
Need a deep-dive on the concept behind this application? Look no further. Learn more about this topic, advanced-math and related others by exploring similar questions and additional content below.Recommended textbooks for you
Algebra & Trigonometry with Analytic Geometry
Algebra
ISBN:
9781133382119
Author:
Swokowski
Publisher:
Cengage

Algebra: Structure And Method, Book 1
Algebra
ISBN:
9780395977224
Author:
Richard G. Brown, Mary P. Dolciani, Robert H. Sorgenfrey, William L. Cole
Publisher:
McDougal Littell

Linear Algebra: A Modern Introduction
Algebra
ISBN:
9781285463247
Author:
David Poole
Publisher:
Cengage Learning
Algebra & Trigonometry with Analytic Geometry
Algebra
ISBN:
9781133382119
Author:
Swokowski
Publisher:
Cengage
Algebra: Structure And Method, Book 1
Algebra
ISBN:
9780395977224
Author:
Richard G. Brown, Mary P. Dolciani, Robert H. Sorgenfrey, William L. Cole
Publisher:
McDougal Littell
Linear Algebra: A Modern Introduction
Algebra
ISBN:
9781285463247
Author:
David Poole
Publisher:
Cengage Learning