(b) Using a cross-country data of 38 countries, we obtain the following equation: Log(eduexp)= -5.43 + 1.23 log(GDP), -0.16 log(population) : R = 0.8853 (se) %3D (0.81) (0.079) (0.078) where eduexp: Education Expenditures (in $000), GDP: Gross Domestic Product (000$), and population (million) for several Countries. Obtain the t-statistic for the population coefficient and test if this coefficient is significantly different from zero. Clearly explain your answer with the help of a diagram. (c) Report the elasticity of education spending with respect to changes in population. Provide justification for your answer. (d) Test using appropriate procedure if GDP and population are jointly significantly different from zero.
(b) Using a cross-country data of 38 countries, we obtain the following equation: Log(eduexp)= -5.43 + 1.23 log(GDP), -0.16 log(population) : R = 0.8853 (se) %3D (0.81) (0.079) (0.078) where eduexp: Education Expenditures (in $000), GDP: Gross Domestic Product (000$), and population (million) for several Countries. Obtain the t-statistic for the population coefficient and test if this coefficient is significantly different from zero. Clearly explain your answer with the help of a diagram. (c) Report the elasticity of education spending with respect to changes in population. Provide justification for your answer. (d) Test using appropriate procedure if GDP and population are jointly significantly different from zero.

Chapter6: Exponential And Logarithmic Functions
Section6.8: Fitting Exponential Models To Data
Problem 3TI: Table 6 shows the population, in thousands, of harbor seals in the Wadden Sea over the years 1997 to...

Related questions
Question
5
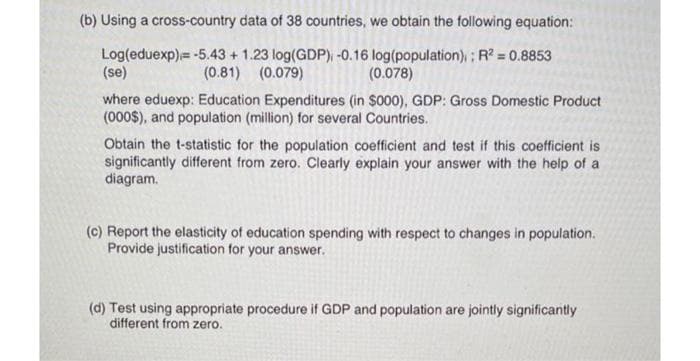
Transcribed Image Text:(b) Using a cross-country data of 38 countries, we obtain the following equation:
Log(eduexp)= -5.43 + 1.23 log(GDP), -0.16 log(population) ; R? = 0.8853
(se)
(0.81) (0.079)
(0.078)
where eduexp: Education Expenditures (in $000), GDP: Gross Domestic Product
(000$), and population (million) for several Countries.
Obtain the t-statistic for the population coefficient and test if this coefficient is
significantly different from zero. Clearly explain your answer with the help of a
diagram.
(c) Report the elasticity of education spending with respect to changes in population.
Provide justification for your answer.
(d) Test using appropriate procedure if GDP and population are jointly significantly
different from zero.
Expert Solution
This question has been solved!
Explore an expertly crafted, step-by-step solution for a thorough understanding of key concepts.

Step by step
Solved in 3 steps

Recommended textbooks for you

Algebra & Trigonometry with Analytic Geometry
Algebra
ISBN:
9781133382119
Author:
Swokowski
Publisher:
Cengage

Algebra for College Students
Algebra
ISBN:
9781285195780
Author:
Jerome E. Kaufmann, Karen L. Schwitters
Publisher:
Cengage Learning
Algebra & Trigonometry with Analytic Geometry
Algebra
ISBN:
9781133382119
Author:
Swokowski
Publisher:
Cengage
Algebra for College Students
Algebra
ISBN:
9781285195780
Author:
Jerome E. Kaufmann, Karen L. Schwitters
Publisher:
Cengage Learning

Intermediate Algebra
Algebra
ISBN:
9781285195728
Author:
Jerome E. Kaufmann, Karen L. Schwitters
Publisher:
Cengage Learning