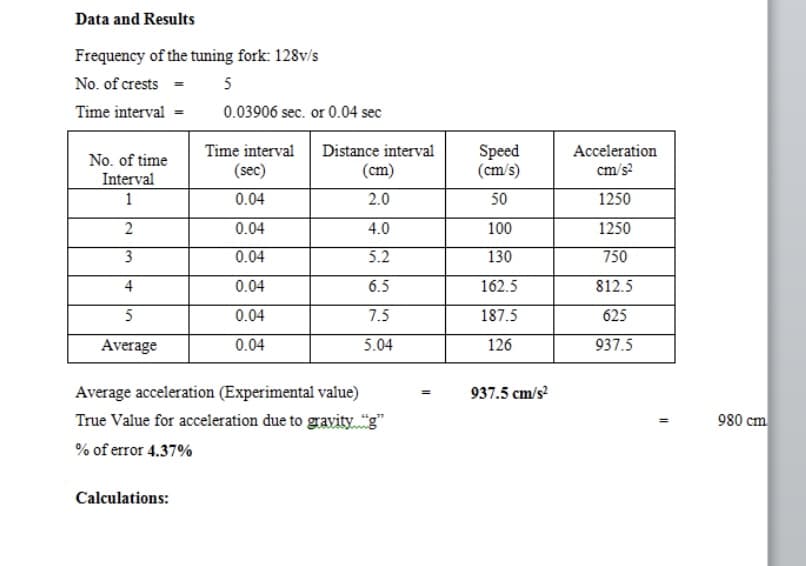
Based on the table given (image attached), a. Draw the distance vs. time graph. Find the slope. b. Describe the graph line. What does it imply?

Q: A uniform electric field has magnitude E and is directed in the negative x direction. The potential ...
A: Concept used: Electric field is negative of gradient of potential. Work done on point charge is amou...
Q: 1 Question 8 Ntyet a d Pnts oat of L00 F ution The circuit shown in the figure contains three resist...
A:
Q: Question 1 AA system consists of a thin and uniformly charged rod of length L-0.6 m and net electric...
A:
Q: Q.5, a Draw riple quantum well laser diode ALSO tell the method to improve -I-N photodiode? Name tha...
A: There are several types of pn-junction diodes are available, among them photo diode is one of this t...
Q: The grating equation tells you at what angles different colors of light will appear. Make sketch bas...
A: The condition for maxima for a light passing through a diffraction grating is given by : The wavel...
Q: dv + 5v = 10B(t), dt v(0) = 0 %3D For this problem we are just going to look at the equation for the...
A: A physical device which converts chemical energy to electrical energy is known as battery. So it is ...
Q: A uniform electric field has magnitude E and is directed in the negative xx direction. The potential...
A: Given: The distance of point aa from the origin is, xa =0.50 mm. The distance of point bb from the ...
Q: A simple pendulum has a mass of 0.250 kg and a length of 1.00 m. It is displaced through an angle of...
A: Given : m=0.25kg, l=1m, θ=15° Refer to a simple pendulum below :
Q: Two masses m1 and m2(m 1>m2) are connected by massless flexible and inextensible string passes ov...
A: Given: Two masses m1 and m2 are connected by string String is massless, flexible and inextensible St...
Q: A simple pendulum of length L and mass m is pivoted to the mass M which slides without friction on a...
A: Given: Mass of pendulum = m Mass of block = M Spring stiffness = k θ is angle through which the pe...
Q: An object is placed in front of a concave mirror with a 20-cm focal length. What is the position of ...
A: The following data and concepts will be used: Focal Length of the concave mirror, f=-20cm (minus sig...
Q: part A and B
A: The natural frequency is given by The damping ratio is The damped natural frequency is
Q: The instantaneous position of a particle atong the x-axis is given by: x(t) = 9.75 + (1.5) t3; x in ...
A: “Since you have posted a question with multiple sub-parts, we will solve first three sub-parts for y...
Q: Q1; The voltage across coaxial capcitorLaflace equation with boundary Conditions. V= 6 at p=a,V =0 a...
A:
Q: Nuclear sizes are expressed in a unit named A) Fermi B) Angstrom C) Newton D) Tesla
A: We have to find the unit to measure the nuclear sizes- The explanation in detail is given below-
Q: consider seven masses located at the vertices of a regular straight pyramid with hexagonal base whos...
A: Given that: Edge of the regular hexagon=a Height of the regular hexagon= h Masses at the vertices of...
Q: The combined mass of the person and bicycle is m. The location of their combined centre of mass is s...
A: Given: Cm = Centre of mass h = distance of ground from centre of mass b = distance of front wheel po...
Q: No current will flow between two charged bodies if they have the same A) resistance B) charg...
A: The question given as- No current will flow between two charged bodies if they have the same Explan...
Q: Hello, I read somewhere that each pole of a magnet has a magnetic vortex. Thus the 3d model of the t...
A: Magnetic vortex- It is a spatial distribution of local magnetisation.
Q: We know that most of Quantum mechanical phenomenon can solved using Schrodinger wave Equation (SWE)...
A: Quantum mechanics is the field of physics that generally deals with atomic and sub-atomic particles,...
Q: Two uniform L-shaped frames, each arm of which is of length l and mass m are moving towards each oth...
A: To determine the final angular velocity about the center of mass of the system.
Q: A regular plane wave propagating in Medium 1 with =1=4 is perpendicular to Medium 2 with er2=9. Both...
A: When an electromagnetic wave travelling in a medium, goes into another medium, then some part of the...
Q: Q5) Current density is distributed as l'ollows J=0 for [} > 2m, J= 8ja. A/m* for ¥l
A: Given: To find the H using the symmetry and Ampere's law as,
Q: 5-) Given the flux density by the equation. Determine the flow through a circular cylinder with the ...
A: Given: D = 20 e-ρ/b aρ - 2 z/b az The standard cylindrical coordinates are (ρ, Φ, z) ρ = 2b 0 <z...
Q: Three charges are at the corners of an equilateral triangle as shown in Figure below Calculate the 3...
A: This is a triangle with one side 57° as shown in the figure and the other base angle taken as 60° (...
Q: What do you mean by constant of motion. Using Heisenberg equation of motion, prove that the expect...
A:
Q: Water is pumped from a lake to a storage tank 25 m above at a rate of 70 L/s while consuming 22.4 kW...
A:
Q: QU answer the following: ) A screen is placed at a certain distance from a narrow slit which isllami...
A: More than one non interrelated questions are asked, so first one is solved. When a screen is placed ...
Q: Book name:Computational Physics
A: Given, y=cos(15x)/(1+x2)
Q: In the Newton’s rings arrangement, if the incident light consists of two wavelengths 4000Å and 4002Å...
A: Given
Q: As a torque activity, your Physics TA sets up the arrangement shown below. A uniform rod of mass mr ...
A: When a system is in equilibrium then there will be two simultaneous conditions to be satisfied. Tota...
Q: A box-shaped metal can have dimensions 8 in. by 4 in. by 10 in. high. All of the air inside the can ...
A: Given: The length of the box is, l = 8 in = 0.2032 m The width of the box is, w = 4 in = 0.1016 m T...
Q: What are the mechanism behind lasing action?Can you explain them with more detail.
A: Light Amplification by the Stimulated Emission of Radiation is the acronym for LASER. It is an elect...
Q: A far-sighted student has a near point of 1.5 m. Calculate the focal length (in cm) of the glasses n...
A: Given: A far-sighted student has a near point of 1.5 m. x =1.5 m 1 m = 100 cm so x = 1.5 X 100 cm ...
Q: Q. 5(b): How current and current density is related? Under what conditions of current d scalar and v...
A: let current = i current density = j cross sectional area = A Then the relationship between current...
Q: 3. Suppose that resistor A has a resistance of 15 Q, and that it exists in a circuit with a battery ...
A: Given data, Resistance of the resistor = 15 ohms EMF of the battery = 120 volts
Q: Nuclear sizes are expressed in a unit named A) Fermi B) Angstrom C) Newton D) Tesla
A: We have to find the unit used to denote the nuclear sizes- The explanation is given below-
Q: Two spaceships are each 25 m long, as measured in their rest frames. Ship A is approachingEarth at 0...
A:
Q: Please Solve the problem question quantum physics.... With the step, thank u
A: The transmission coefficient for a potential wall undergoing quantum breakthrough i.e. quantum tunne...
Q: Activity 2.2. Shrinking Ship Danny is driving a spaceship with a length of 60 meters at the speed of...
A: Given, Length of spaceship L= 60m v= 0.32c Formula for length contraction L'=L1-v2/c2L'=601-(0.32c)2...
Q: Advanced Physics Question
A: Scintillation is defined as the process of giving off light, more specifically light in the ultravio...
Q: please explain each step briefly
A:
Q: If three resistors connected in series to a battery. Suppose R, carries a current of 17.5A, R2 has a...
A: Now it is given that all the resistors are connected in series. This means all the resistor will hav...
Q: Please show work:)
A:
Q: If a (non-ideal) gas has non-negligible attractive intermolecular forces, would you expect the tempe...
A:
Q: Question 5 A pr ndn el eraunifom magnetie field. The velocity vector of cach particle is perpendicul...
A:
Q: From kinematics and dynamics, will work have direction? Explain.
A: Work done is the product of force and displacement.
Q: 2. Suppose a spacecraft is moving in free space with a constant velocity of magnitude 0.25 c relativ...
A: The velocity of the spacecraft is given as, v=0.25c TO DETERMINE: The relative velocity back to the...
Q: A block having mass m = 4 kg and charge q = 50 µC is connected to a spring having a force constant k...
A: A body when acted upon by multiple forces, it is said to be in equilibrium at a point where the net ...
Q: An air bubble in water will act like a A) convex lens B) convex mirror C) concave lens D) c...
A: When light travels from a denser medium to a rarer medium, it bends away from the normal. This pheno...
Based on the table given (image attached),
a. Draw the distance vs. time graph. Find the slope.
b. Describe the graph line. What does it imply?

Step by step
Solved in 3 steps with 2 images
