Below is a graph of a normal distribution with mean u = -2 and standard deviation o = 3. The shaded region represents the probability of obtaining a value from this distribution that is between -5 and -0.5. 0.4- 0.3- 0.2- 4.1-
Below is a graph of a normal distribution with mean u = -2 and standard deviation o = 3. The shaded region represents the probability of obtaining a value from this distribution that is between -5 and -0.5. 0.4- 0.3- 0.2- 4.1-

A First Course in Probability (10th Edition)
10th Edition
ISBN:9780134753119
Author:Sheldon Ross
Publisher:Sheldon Ross
Chapter1: Combinatorial Analysis
Section: Chapter Questions
Problem 1.1P: a. How many different 7-place license plates are possible if the first 2 places are for letters and...

Related questions
Question
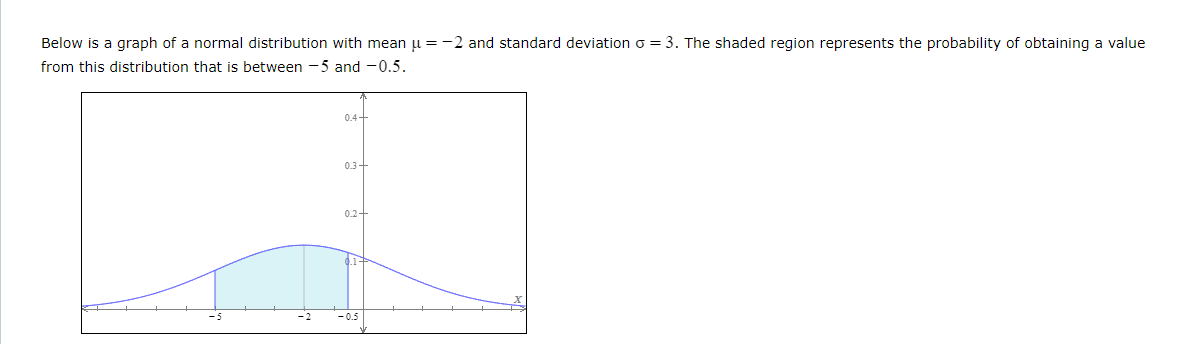
Transcribed Image Text:Below is a graph of a normal distribution with mean u = -2 and standard deviation o = 3. The shaded region represents the probability of obtaining a value
from this distribution that is between -5 and -0.5.
0.4-
0.3-
0.2-
.1-
-5
- 0.5
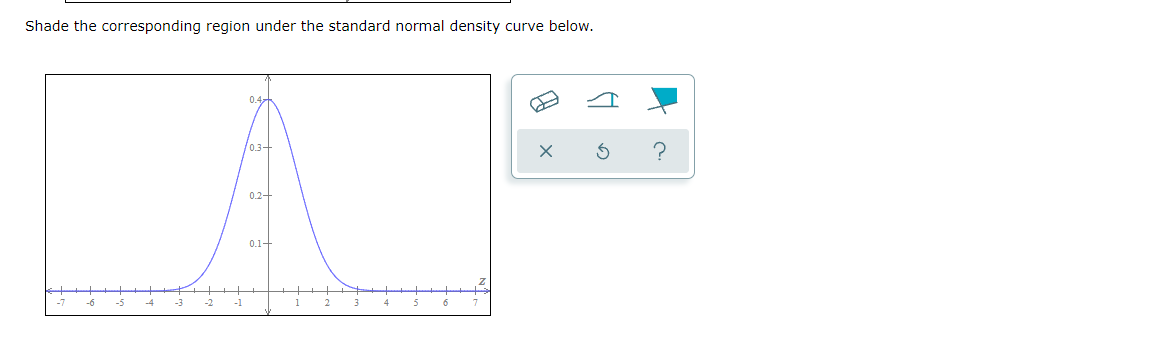
Transcribed Image Text:Shade the corresponding region under the standard normal density curve below.
0.3+
0.2-
0.1-
-1
Expert Solution
This question has been solved!
Explore an expertly crafted, step-by-step solution for a thorough understanding of key concepts.

Step by step
Solved in 2 steps with 2 images

Recommended textbooks for you
A First Course in Probability (10th Edition)
Probability
ISBN:
9780134753119
Author:
Sheldon Ross
Publisher:
PEARSON

A First Course in Probability (10th Edition)
Probability
ISBN:
9780134753119
Author:
Sheldon Ross
Publisher:
PEARSON