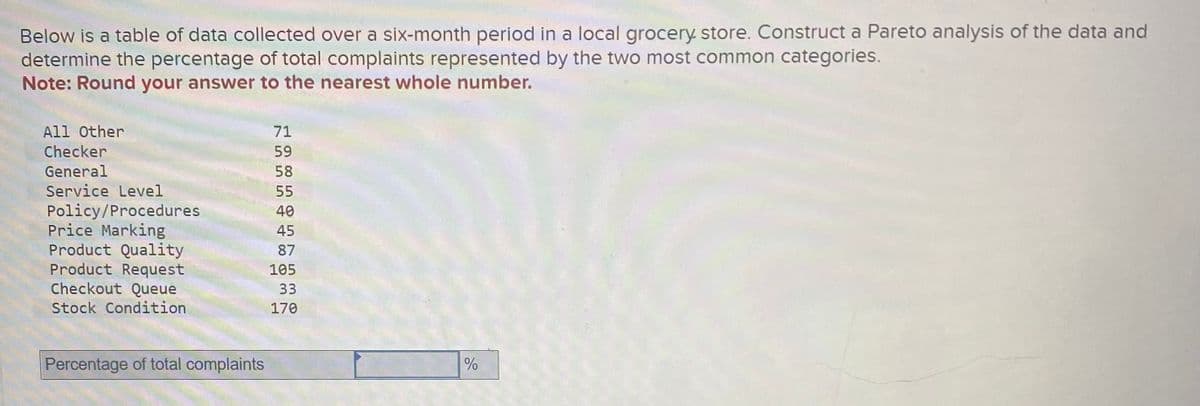
Below is a table of data collected over a six-month period in a local grocery store. Construct a Pareto analysis of the data and determine the percentage of total complaints represented by the two most common categories. Note: Round your answer to the nearest whole number. All Other Checker General Service Level Policy/Procedures Price Marking Product Quality Product Request Checkout Queue Stock Condition. Percentage of total complaints 71 59 58 55 40 45 87 105 33 170 %


Q: b. What is the workstation cycle time required to meet the desired output rate? Workstation cycle…
A: Project schedule helps in calculating different values all related to the production cycle like the…
Q: In the context of the components of turnover costs, list the eight cost elements associated with…
A: Employee turnover, or employee turnover rate can be defined as the estimation of the number of…
Q: a-1. If the inspector position is eliminated, what will the hourly cost of defects be? Note: Round…
A: To calculate the financial losses caused by product defects, businesses often keep track of the…
Q: TelecomOne has manufacturing plants located in Baltimore, Memphis, and Wichita and serves markets in…
A: This is a case of transportation whereing we need to decide which of the plausible warehouses can be…
Q: b PCO с d e 10 14 nt 9 10 8 f g 8 8 ct 7 8 nc CC 175 375 275 505 375 375 b,c 275 455 b,c 6 225 535…
A: The critical Path Method is a concept of operations management that is used to determine which tasks…
Q: Five characteristic that makes constructng a bridge consider to be a project. This question is…
A: Project management is planning and organizing the resources that are used to complete the required…
Q: Invoice clearance and payment procedures: Are best performed by the user or specifier Are the same…
A: ANSWER:1 The other options are incorrect: Ideally, the user or specifier should: Users and…
Q: 2 ERP articles review.
A: Article 1: "ERP Implementation Challenges: A Review and Future Directions" by Gao, Pan, and Xu…
Q: What is the difference between an Inspection / Formal Review / Walkthrough?
A: Walkthrough is a type of companion review in which a developer drives the review cycle and the other…
Q: Financial analysis should be used as an input to decision making, not as the decision-making…
A: Financial analysis is the process of analyzing the financial performance of companies using certain…
Q: in a paragraph can you explain how businesses use project managment and forcasting
A: Project management and forecasting are essential tools that businesses use to plan, execute, and…
Q: Assume you are the project manager for the Tidal 2 software project. You have been asked to…
A: Estimated Total function points = 15+9+9+33+23 = 89 Estimated duration = Total function points /…
Q: 1. Using a three-month moving average, what are the forecast sales for next January (month 13)? 2.…
A: Forecasting is the process of estimating the future demands based on the previous data and…
Q: Reflection Topic: The Importance of Taking Breaks In this assignment, you are required to submit the…
A: While working on an intricate problem or when you feel that you have a lot to do, it is not…
Q: Which of the following level of operational risks relates to model errors and losses arising from…
A: Introduction Operational risk refers to the potential for losses resulting from inadequate or failed…
Q: Explain in brief ‘Management’ as an activity?
A: Management, as a practice, is keeping tabs on every facet of an organization throughout the course…
Q: A store’s demand figures are given in the table. According to this, what is the linear regression…
A: Regression analysis can be defined as a numerical technique used to figure out the connection…
Q: Hyundai Motors is considering three sites-A, B, and C-at which to locate a factory to build its…
A:
Q: AlwaysRain Irrigation, Incorporated would like to determine capacity requirements for the next four…
A: Given data: For Plastic sprinklersMachine available = 1Capacity to produce sprinklers =280,000No.…
Q: Stanford Rosenberg Computing wants to establish an assembly line for producing a new product, the…
A: The data given in the question is: Production goal = 170 PDAs per hour
Q: a. What is the current profit and proposed profit of the sales of AudioCables? (Leave no cells blank…
A: Current information: Variable Cost (VC) = $ 0.50 Selling Price (SP) = $ 1.00 Fixed Cost (FC) = $…
Q: The following assembly tasks (with performance time in minutes and task precedence) are to be…
A: Part A: Below mentioned is the precedence diagram of assembly elements from A to L.
Q: Leadership Theory, what is it?
A: Theories of leadership are very well presumptions regarding the psychology of a specific kind of…
Q: Gamestop Identify the conditions that foster individual, team, and organizational…
A: The Gamestop phenomenon in early 2021 provides an interesting case study for analyzing the…
Q: The table below provides the aggregate plan of messanger bags produced by Timbuk2. It is known that…
A: Given aggregate plan-
Q: The payoffs to investing in a small or large apartment building are summarized in the table below.…
A: Given-
Q: Please explain any two advances in computer technology that have led to the increased productivity…
A: Technology is something delightful and it comes a seriously long way throughout the long term. One…
Q: . What are the differences between in-house e-commerce development with packaged solutions and…
A: In-house e-commerce development is generally normal among enterprise companies, Having an in-house…
Q: Up, Up, and Away is a producer of kites and wind socks. Relevant data on the bottleneck operation in…
A: Formulas used: No. of lots Required = Demand Lot size Time to setup=No. of lots× Standard setup…
Q: I would appreciate it if you could describe the Service Process Structuring.
A: The structure used to plan and oversee service delivery processes in businesses is referred to as…
Q: The owner of a large machine shop has just finished its financial analysis from the prior fiscal…
A: a. To compute the inventory turnover ratio (ITR), we need to divide the cost of goods sold by the…
Q: Schedule the following activities using CPM: ACTIVITY IMMEDIATE PREDECESSOR ABCDEFGH TAABCDFE А А C,…
A: The critical path or paths shows the longest duration (in time) till beginning to end and it specify…
Q: Methods of communication within the project and the technologies that may be used to improve them…
A: A lot of weight rests on shoulders of a project manager. Although managing projects is crucial,…
Q: For the past month, a plant that has an effective capacity of 6,000 has made only 5,000 hammers per…
A: The efficiency of the plant can be determined as the actual output divided by effective capacity.…
Q: 4.4 A check-processing center uses exponential smooth- ing to forecast the number of incoming checks…
A: The above-given question is to check whether exponential smoothing is a good method for the given…
Q: What are the main advantages of Qualitative Research relative to Quantitative Research?
A: Qualitative research and quantitative research are two distinct approaches to research that have…
Q: Find the reorder point necessary to provide a 99 percent service probability.
A: Annual Demand (D) = 14,700 units Weekly Demand (d) = 283 units Standard Deviation of Demand (σd) =…
Q: How do transaction processing, customer relationship management, and supply chain management systems…
A: A project management life cycle is a process with different stages like initiating, planning,…
Q: Lenovo uses the ZX-81 chip in some of its laptop computers. The prices for the chip during the last…
A: 2-month moving average is the average of past 2 month
Q: What is the difference between egalitarian and hierarchical cultures?
A: The area of management known as operations management is focused on planning, directing, and…
Q: dentify at least four (4) critical issues that the project management team faced in executing,…
A: Project management is a process of planning, organizing, and managing resources to achieve specific…
Q: 3) What is the estimated expected (mean) time for project completion? A. 22 days B. 72 days C. 100…
A: A network diagram shows the sequence of the task that is done to complete a project. It usually…
Q: what is the implied utilization of the issue license?
A: Implied Utilization = (Actual Output / Maximum Possible Output) x 100% Actual output per hour = 75%…
Q: Week Actual Forecast 1 20.2 40.1 2 44.5 58.1 3 40.2 47.5 4 60.6 61.6 5 56.3 65.7 6 71.5 91.4 7 80.2…
A: Given-
Q: Your company assembles five different models of a motor scooter that is sold in specialty stores in…
A: EOQ or economic order quantity is a business production model that lets an organization know how…
Q: You are given the demand and forecast history for Apple iPhone 12. According to this, what is the…
A: Here, I have been given the actual demand and forecasted demand for each week, I would apply the…
Q: What are the most important features that would influence a customer to buy a smartphone
A: There are multiple prominent features that would influence a customer to buy a smartphone, a…
Q: What are some threats
A: Due to the trend toward sustainability and environmental responsibility, there is now more demand…
Q: Explain the many resources that may be used to improve project management coordination. Detailed…
A: Effective project management coordination is essential for fruitful project completion. The…
Q: Week Actual Ft Tt FIT 1 29.0 42.1 8.67 50.77 2 33.0 47.2 8.57 55.77 3 48.0 63.3 9.77 73.07 4 50.0…
A: Formula used: Smoothed Forecast (Ft) = FITt-1+Alpha * (At-1 - FITt-1) Smoothed Trend (Tt)= Tt-1 +…
80


Trending now
This is a popular solution!

Step by step
Solved in 2 steps

- The Baker Company wants to develop a budget to predict how overhead costs vary with activity levels. Management is trying to decide whether direct labor hours (DLH) or units produced is the better measure of activity for the firm. Monthly data for the preceding 24 months appear in the file P13_40.xlsx. Use regression analysis to determine which measure, DLH or Units (or both), should be used for the budget. How would the regression equation be used to obtain the budget for the firms overhead costs?The owner of a restaurant in Bloomington, Indiana, has recorded sales data for the past 19 years. He has also recorded data on potentially relevant variables. The data are listed in the file P13_17.xlsx. a. Estimate a simple regression equation involving annual sales (the dependent variable) and the size of the population residing within 10 miles of the restaurant (the explanatory variable). Interpret R-square for this regression. b. Add another explanatory variableannual advertising expendituresto the regression equation in part a. Estimate and interpret this expanded equation. How does the R-square value for this multiple regression equation compare to that of the simple regression equation estimated in part a? Explain any difference between the two R-square values. How can you use the adjusted R-squares for a comparison of the two equations? c. Add one more explanatory variable to the multiple regression equation estimated in part b. In particular, estimate and interpret the coefficients of a multiple regression equation that includes the previous years advertising expenditure. How does the inclusion of this third explanatory variable affect the R-square, compared to the corresponding values for the equation of part b? Explain any changes in this value. What does the adjusted R-square for the new equation tell you?Do the sales prices of houses in a given community vary systematically with their sizes (as measured in square feet)? Answer this question by estimating a simple regression equation where the sales price of the house is the dependent variable, and the size of the house is the explanatory variable. Use the sample data given in P13_06.xlsx. Interpret your estimated equation, the associated R-square value, and the associated standard error of estimate.
- The following gives the number of accidents that occurred on Florida State Highway 101 during the last 4 months: Month Jan Feb Mar Apr Number of Accidents 25 45 60 95 Part 2 Using the least-squares regression LOADING... method, the trend equation for forecasting is (round your responses to two decimal places): y = + enter your response herex Part 3 Using least-squares regression, the forecast for the number of accidents that will occur in the month of May = enter your response here accidents (enter your response as a whole number).Kay and Micheal Passe publish what's Happening?--a biweekly newspaper to publicize local events. whats happening? has a few subscribers; it typically is sold at checkout stands. Much of the revenue comes from advertisers of garage sales and supermarket specials. In an effort to reduce costs associated with printing too many papers or delivering them to the wrong location, Micheal implemented a computerized system to collect sales data. Sales-counter scanners accurately record sales data for each location. Since the system was implemented, total sales volume has steadily declined. selling advertising space and maintainting shelf space at supermarkets are getting deifficult. Reduced revenue makes controlling costs all the more important. For each issue. Micheal caefully makes a forecast based on sales data collected at each location. Then he orders papers to be printed and distributed in quantities matching the forecast. Micheal's forecast refect a downward trend, which is present in the…Fire Department Turns to BI Analytics. New York City has nearly one million buildings, and each year, more than 3000 of them experience a major fire. The Fire Department of the City of New York (FDNY) is adding BI analytics to its arsenal of firefighting equipment. It has created a database of over 60 different factors (e.g., building location, age of the building, whether it has electrical issues, the number and location of sprinklers) in an attempt to determine which buildings are more likely to have a fire than others. The values of these parameters for each building are fed into a BI analytics system that assigns each of the city's 330,000 inspectable buildings a risk score. (FDNY doesn't inspect single and two-family homes.) Building inspectors then use these risk scores to prioritize which buildings to visit on their weekly inspections. The FDNY has roughly 350 inspectors who are trained and certified to perform their duties.Which set of three parameters all provide measures…
- Consider the following time series data. Choose the correct time series plot. What type of pattern exists in the data? Develop a three-week moving average for this time series. Compute MSE and a forecast for week 7. Round your answers to two decimal places. = 0.2 to compute the exponential smoothing values for the time series. Compute MSE and a forecast for week 7. Round your answers to two decimal places. Compare the three-week moving average forecast with the exponential smoothing forecast using Use trial and error to find a value of the exponential smoothing coefficient that results in a smaller MSE than what you calculated for = 0.2. Find a value of for the smallest MSE. Round your answer to three decimal places.What is USC-CT problem solving process and how is it used, provide examples? please no plagarism.. Alexandera is the Research manager with Freezemore Appliances. Freezemore has bee receiving a LOT of complaints with one of it’s most popular refrigerators. The refrigerator freezes everything in both the freezer and the refrigerator freeing everything inside. The vice president of marketing told Alexandra that “we need to quickly discover how to turn this problem into a desirable situation. You need to determine the underlying cause of the problem and perhaps even make improvements to the freezer.” When Alexandra analyzes the underlying causes of the freezing problem, which function is she performing? a. analytics b. feasibility c. MBO d.synergy e. diagnosis
- The State of Virginia has instituted a series of Standards ofLearning (SOL) tests in math, history, English, and sciencethat all high school students must pass with a grade of 70 be-fore that are allowed to graduate and receive their diploma.The school superintendent of Montgomery County believesthe tests are unfair because they are closely related to teachersalaries and teacher school tenure (i.e., the years a teacher hasbeen at a school). The superintendent has sampled 12 othercounty school systems in the state and accumulated thefollowing data for average teacher salaries and averageteacher tenure.a. Using Excel, develop the multiple regression equationfor these data.b. What is the coefficient of determination for thisregression equation? Do you think the superintendentis correct in his beliefs?c. Montgomery County has an average SOL score of 74with an average teacher’s salary of $27,500 and anaverage teacher tenure of 7.8 years. The superintendenthas proposed to the school board a…The following gives the number of accidents that occurred on Florida State Highway 101 during the last 4 months: Month Jan Feb Mar Apr Number of Accidents 30 48 70 90 Part 2 Using the least-squares regression LOADING... method, the trend equation for forecasting is (round your responses to two decimal places): y = enter your response here + enter your response here x Y=?+?xThe classified department of a monthly magazine has used a combination of quantitative and qualitative methods to forecast sales of advertising space. Results over a 20-month period are as follows:Month Error1 −8 2 −2 3 4 4 7 5 9 6 5 7 0 8 −3 9 −9 10 −4 11 1 12 6 13 8 14 4 15 1 16 −2 17 −4 18 −8 19 −5 20 −1 a. Compute a tracking signal for months 11 through 20. Compute an initial value of MAD for month 11, and then update it for each month using exponential smoothing with α = .1. What can you conclude? Assume limits of ± 4.b. Using the first half of the data, construct a control chart with 2s limits. What can you conclude?c. Plot the last 10 errors on the control chart. Are the errors random? What is the implication of this?