Bernasconi Park (outside)kk (37.332102 -120.438259) Primary 10 minute_average 09_16_2021 09_27_2022.xls x с D A 123 UTC Text created_at 2021-09-16 00:00:00 UTC 2021-09-16 00:10:00 UTC 4 2021-09-16 00:20:00 UTC 5 2021-09-16 00:30:00 UTC 6 2021-09-16 00:40:00 UTC 7 2021-09-16 00:50:00 UTC B VarName2 Number Number PM1.0_C... PM2.5_CF1_ug/m3 5.8900 4.7100 4.3900 3.7000 3.9200 3.6800 Show Transcribed Text VarName3 E BernasconiParkoutsidekk37 F G VarName4 VarName5 VarName6 VarName 7 VarName8 Number Number Number Number -Number Number PM10.0 UptimeM... RSSI_dbm Tempera... Humidity... PM2.5_ATM_ug/m3 16.4600 10279 9 12.9000 9.9800 12.5600 -69 112 10289 -68.6000 111.8000 10299 -67.2000 110.4000 9.2000 8.4200 9.6600 10 8.1500 9.5900 10309 -68 108.6000 10 8.2200 9.4100 10319-66.6000 7.8400 8.7400 10329 -66.4000 H 108 107 VarName9 10.6000 11 12.9000 9.9800 8.4200 8.1500 8.2200 7.8400 Hello, I need help figuring out how to code a plot for my data. I have 65535 rows of data. My goal is to do a concentration for the y - axis and x-axis for time. How do I plot this with MATLAB?
Bernasconi Park (outside)kk (37.332102 -120.438259) Primary 10 minute_average 09_16_2021 09_27_2022.xls x с D A 123 UTC Text created_at 2021-09-16 00:00:00 UTC 2021-09-16 00:10:00 UTC 4 2021-09-16 00:20:00 UTC 5 2021-09-16 00:30:00 UTC 6 2021-09-16 00:40:00 UTC 7 2021-09-16 00:50:00 UTC B VarName2 Number Number PM1.0_C... PM2.5_CF1_ug/m3 5.8900 4.7100 4.3900 3.7000 3.9200 3.6800 Show Transcribed Text VarName3 E BernasconiParkoutsidekk37 F G VarName4 VarName5 VarName6 VarName 7 VarName8 Number Number Number Number -Number Number PM10.0 UptimeM... RSSI_dbm Tempera... Humidity... PM2.5_ATM_ug/m3 16.4600 10279 9 12.9000 9.9800 12.5600 -69 112 10289 -68.6000 111.8000 10299 -67.2000 110.4000 9.2000 8.4200 9.6600 10 8.1500 9.5900 10309 -68 108.6000 10 8.2200 9.4100 10319-66.6000 7.8400 8.7400 10329 -66.4000 H 108 107 VarName9 10.6000 11 12.9000 9.9800 8.4200 8.1500 8.2200 7.8400 Hello, I need help figuring out how to code a plot for my data. I have 65535 rows of data. My goal is to do a concentration for the y - axis and x-axis for time. How do I plot this with MATLAB?

Computer Networking: A Top-Down Approach (7th Edition)
7th Edition
ISBN:9780133594140
Author:James Kurose, Keith Ross
Publisher:James Kurose, Keith Ross
Chapter1: Computer Networks And The Internet
Section: Chapter Questions
Problem R1RQ: What is the difference between a host and an end system? List several different types of end...

Related questions
Question
100%
Please send me answer within 10 min!! I will rate you good for sure!!
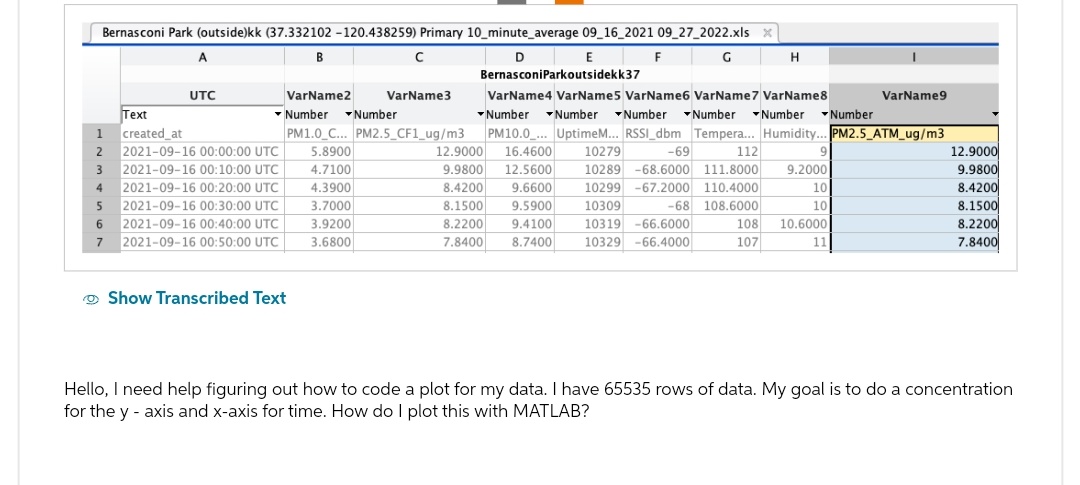
Transcribed Image Text:Bernasconi Park (outside)kk (37.332102 -120.438259) Primary 10_minute_average 09_16_2021 09_27_2022.xls
B
D
A
UTC
Text
1
created_at
2 2021-09-16 00:00:00 UTC
3 2021-09-16 00:10:00 UTC
4 2021-09-16 00:20:00 UTC
5 2021-09-16 00:30:00 UTC
6 2021-09-16 00:40:00 UTC
7 2021-09-16 00:50:00 UTC
с
VarName2
Number Number
PM1.0_C... PM2.5_CF1_ug/m3
5.8900
4.7100
4.3900
3.7000
3.9200
3.6800
Show Transcribed Text
VarName3
E
BernasconiParkoutsidekk 37
F
G
VarName4 VarName5 VarName6 VarName 7 VarName8
Number Number Number Number Number Number
PM10.0_... UptimeM... RSSI_dbm Tempera... Humidity... PM2.5_ATM_ug/m3
12.9000
16.4600
10279
-69
112
9.9800 12.5600 10289 -68.6000 111.8000
8.4200 9.6600 10299 -67.2000 110.4000
8.1500 9.5900 10309
-68 108.6000
8.2200 9.4100 10319 -66.6000
7.8400 8.7400 10329 -66.4000
H
108
107
VarName9
9
9.2000
10
10
10.6000
11
12.9000
9.9800
8.4200
8.1500
8.2200
7.8400
Hello, I need help figuring out how to code a plot for my data. I have 65535 rows of data. My goal is to do a concentration
for the y - axis and x-axis for time. How do I plot this with MATLAB?
Expert Solution
This question has been solved!
Explore an expertly crafted, step-by-step solution for a thorough understanding of key concepts.

Step by step
Solved in 3 steps with 1 images

Recommended textbooks for you
Computer Networking: A Top-Down Approach (7th Edi…
Computer Engineering
ISBN:
9780133594140
Author:
James Kurose, Keith Ross
Publisher:
PEARSON

Computer Organization and Design MIPS Edition, Fi…
Computer Engineering
ISBN:
9780124077263
Author:
David A. Patterson, John L. Hennessy
Publisher:
Elsevier Science

Network+ Guide to Networks (MindTap Course List)
Computer Engineering
ISBN:
9781337569330
Author:
Jill West, Tamara Dean, Jean Andrews
Publisher:
Cengage Learning
Computer Networking: A Top-Down Approach (7th Edi…
Computer Engineering
ISBN:
9780133594140
Author:
James Kurose, Keith Ross
Publisher:
PEARSON
Computer Organization and Design MIPS Edition, Fi…
Computer Engineering
ISBN:
9780124077263
Author:
David A. Patterson, John L. Hennessy
Publisher:
Elsevier Science
Network+ Guide to Networks (MindTap Course List)
Computer Engineering
ISBN:
9781337569330
Author:
Jill West, Tamara Dean, Jean Andrews
Publisher:
Cengage Learning

Concepts of Database Management
Computer Engineering
ISBN:
9781337093422
Author:
Joy L. Starks, Philip J. Pratt, Mary Z. Last
Publisher:
Cengage Learning

Prelude to Programming
Computer Engineering
ISBN:
9780133750423
Author:
VENIT, Stewart
Publisher:
Pearson Education

Sc Business Data Communications and Networking, T…
Computer Engineering
ISBN:
9781119368830
Author:
FITZGERALD
Publisher:
WILEY