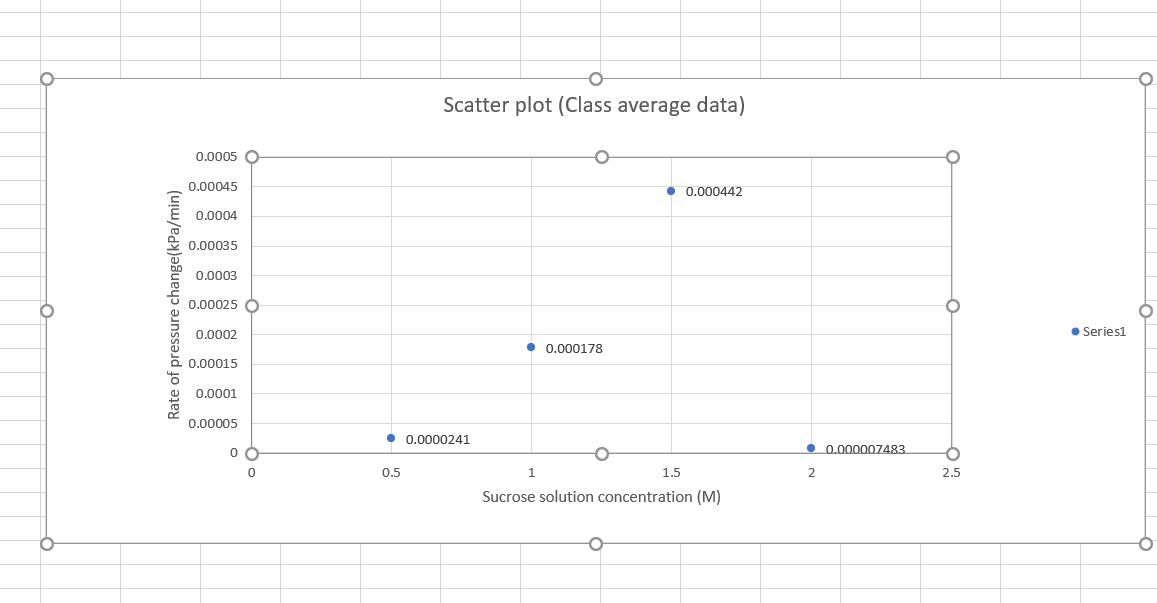
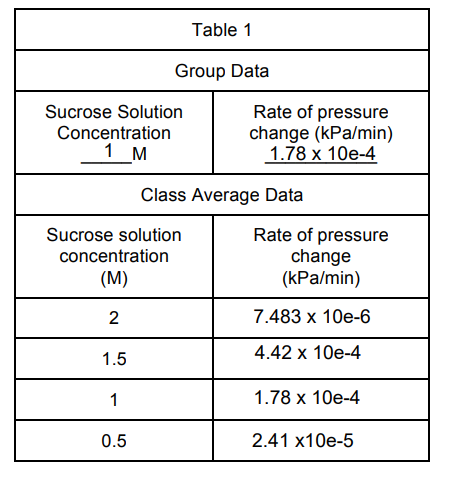
O Rate of pressure change(kPa/min) 0.0005 O 0.00045 0.0004 0.00035 0.0003 0.00025 O 0.0002 0.00015 0.0001 0.00005 0 0 Scatter plot (Class average data) ● 0.0000241 0.5 ● 0.000178 1 ● 0.000442 1.5 Sucrose solution concentration (M) 2 0.000007483 2.5 Series1 Sucrose Solution Concentration 1 M Table 1 Group Data 0.5 Sucrose solution concentration (M) 2 1.5 1 Rate of pressure change (kPa/min) 1.78 x 10e-4 Class Average Data Rate of pressure change (kPa/min) 7.483 x 10e-6 4.42 x 10e-4 1.78 x 10e-4 2.41 x10e-5


Enzyme kinetics
In biochemistry, enzymes are proteins that act as biological catalysts. Catalysis is the addition of a catalyst to a chemical reaction to speed up the pace of the reaction. Catalysis can be categorized as either homogeneous or heterogeneous, depending on whether the catalysts are distributed in the same phase as that of the reactants. Enzymes are an essential part of the cell because, without them, many organic processes would slow down and thus will affect the processes that are important for cell survival and sustenance.
Regulation of Enzymes
A substance that acts as a catalyst to regulate the reaction rate in the living organism's metabolic pathways without itself getting altered is an enzyme. Most of the biological reactions and metabolic pathways in the living systems are carried out by enzymes. They are specific for their works and work in particular conditions. It maintains the best possible rate of reaction in the most stable state. The enzymes have distinct properties as they can proceed with the reaction in any direction, their particular binding sites, pH specificity, temperature specificity required in very few amounts.
I will upload them for your reference and answer the question in your own words. Do not copy and paste from google.
2. Refer to the graph(and table 2) you made for question 1
a. Did the solutions have positive or negative slopes?
b. Do the slopes indicate that water was moving in or out of the cell (dialysis tubing) under these circumstances?
c. Does sucrose move in or out of the cell? Explain.


Trending now
This is a popular solution!

Step by step
Solved in 2 steps


