Bivariate data often arises from the use of two different techniques to measure the same quantity. As an example, the accompanying observations on x = hydrogen concentration (ppm) using a gas chromatography method and y concentration using a new sensor method were read from a graph in an article. y y 200 FILL 150 100 50 130 200 Construct a scatterplot. 200 150 100 x 46 61 65 70 70 77 96 100 114 118 124 127 140 140 140 150 152 164 198 221 93 106 117 116 127 114 134 139 142 170 149 154 200 215 y 38 62 53 68 84 79 50 LAUSE SALT 50 100 150 200 200 150 100 50 30 100 50 100 150 200 200 150 100 50 50 100 150 200 Does there appear to be a very strong relationship between the two types of concentration measurements? Do the two methods appear to be measuring roughly the same quantity? Explain your reasoning. The points fall very close to a straight line with an y-intercept of approximately 225 and a slope of about -1. This suggests that the two methods are producing substantially the same concentration measurements. The points fall very close to a straight line with an y-intercept of approximately 125 and a slope of about 0. This suggests that the two methods are producing substantially the same concentration measurements. The points fall very close to a quadratic line with x-intercepts of approximately 0 and 225. This suggests that the two methods are producing substantially the same concentration measurements. The points fall very close to a quadratic line with x-intercepts of approximately 0 and 225. This suggests that the two methods are producing substantially different concentration measurements. The points fall very close to a straight line with an x-intercept of approximately 0 and a slope of about 1. This suggests that the two methods are producing substantially the same concentration measurements.
Bivariate data often arises from the use of two different techniques to measure the same quantity. As an example, the accompanying observations on x = hydrogen concentration (ppm) using a gas chromatography method and y concentration using a new sensor method were read from a graph in an article. y y 200 FILL 150 100 50 130 200 Construct a scatterplot. 200 150 100 x 46 61 65 70 70 77 96 100 114 118 124 127 140 140 140 150 152 164 198 221 93 106 117 116 127 114 134 139 142 170 149 154 200 215 y 38 62 53 68 84 79 50 LAUSE SALT 50 100 150 200 200 150 100 50 30 100 50 100 150 200 200 150 100 50 50 100 150 200 Does there appear to be a very strong relationship between the two types of concentration measurements? Do the two methods appear to be measuring roughly the same quantity? Explain your reasoning. The points fall very close to a straight line with an y-intercept of approximately 225 and a slope of about -1. This suggests that the two methods are producing substantially the same concentration measurements. The points fall very close to a straight line with an y-intercept of approximately 125 and a slope of about 0. This suggests that the two methods are producing substantially the same concentration measurements. The points fall very close to a quadratic line with x-intercepts of approximately 0 and 225. This suggests that the two methods are producing substantially the same concentration measurements. The points fall very close to a quadratic line with x-intercepts of approximately 0 and 225. This suggests that the two methods are producing substantially different concentration measurements. The points fall very close to a straight line with an x-intercept of approximately 0 and a slope of about 1. This suggests that the two methods are producing substantially the same concentration measurements.

Functions and Change: A Modeling Approach to College Algebra (MindTap Course List)
6th Edition
ISBN:9781337111348
Author:Bruce Crauder, Benny Evans, Alan Noell
Publisher:Bruce Crauder, Benny Evans, Alan Noell
Chapter5: A Survey Of Other Common Functions
Section5.3: Modeling Data With Power Functions
Problem 6E: Urban Travel Times Population of cities and driving times are related, as shown in the accompanying...

Related questions
Question
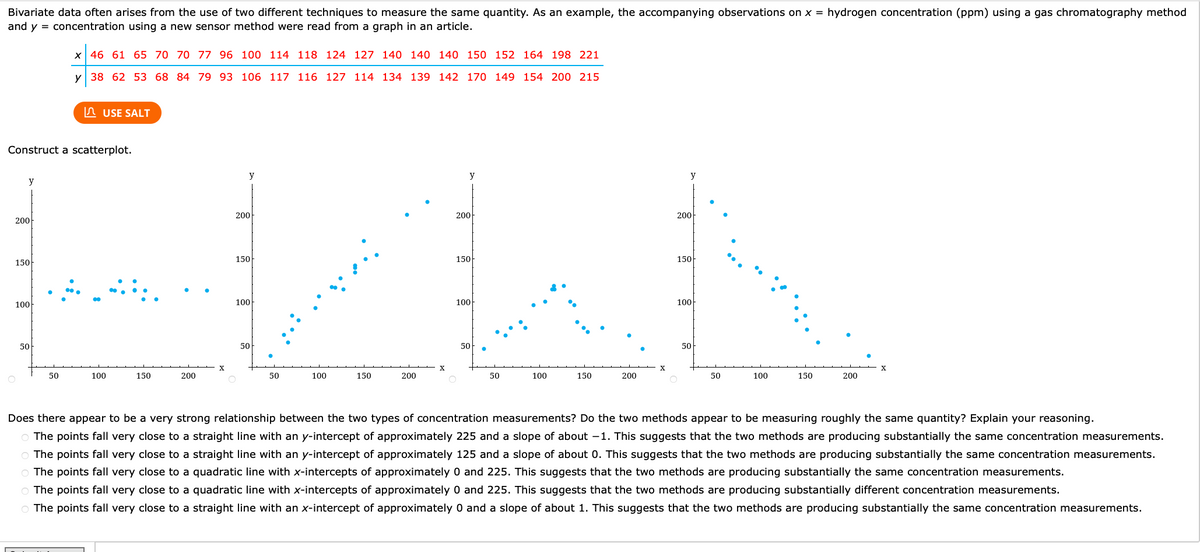
Transcribed Image Text:Bivariate data often arises from the use of two different techniques to measure the same quantity. As an example, the accompanying observations on x = hydrogen concentration (ppm) using a gas chromatography method
and y = concentration using a new sensor method were read from a graph in an article.
Construct a scatterplot.
y
200
150
100
O
50
x 46 61 65 70 70
77 96 100 114 118 124 127 140 140 140 150 152 164 198 221
y 38 62 53 68 84 79 93 106 117 116 127 114 134 139 142 170 149 154 200 215
50
USE SALT
100
150
200
X
y
200
150
100
O
50
●
50
100
150
200
X
y
200
150
100
O
50
50
100
150
200
X
y
200
150
100
O
50
50
100
150
200
X
Does there appear to be a very strong relationship between the two types of concentration measurements? Do the two methods appear to be measuring roughly the same quantity? Explain your reasoning.
o The points fall very close to a straight line with an y-intercept of approximately 225 and a slope of about 1. This suggests that the two methods are producing substantially the same concentration measurements.
o The points fall very close to a straight line with an y-intercept of approximately 125 and a slope of about 0. This suggests that the two methods are producing substantially the same concentration measurements.
O The points fall very close to a quadratic line with x-intercepts of approximately 0 and 225. This suggests that the two methods are producing substantially the same concentration measurements.
O The points fall very close to a quadratic line with x-intercepts of approximately 0 and 225. This suggests that the two methods are producing substantially different concentration measurements.
O The points fall very close to a straight line with an x-intercept of approximately 0 and a slope of about 1. This suggests that the two methods are producing substantially the same concentration measurements.
Expert Solution
This question has been solved!
Explore an expertly crafted, step-by-step solution for a thorough understanding of key concepts.

This is a popular solution!

Trending now
This is a popular solution!

Step by step
Solved in 2 steps with 2 images

Recommended textbooks for you
Functions and Change: A Modeling Approach to Coll…
Algebra
ISBN:
9781337111348
Author:
Bruce Crauder, Benny Evans, Alan Noell
Publisher:
Cengage Learning

Glencoe Algebra 1, Student Edition, 9780079039897…
Algebra
ISBN:
9780079039897
Author:
Carter
Publisher:
McGraw Hill
Functions and Change: A Modeling Approach to Coll…
Algebra
ISBN:
9781337111348
Author:
Bruce Crauder, Benny Evans, Alan Noell
Publisher:
Cengage Learning
Glencoe Algebra 1, Student Edition, 9780079039897…
Algebra
ISBN:
9780079039897
Author:
Carter
Publisher:
McGraw Hill