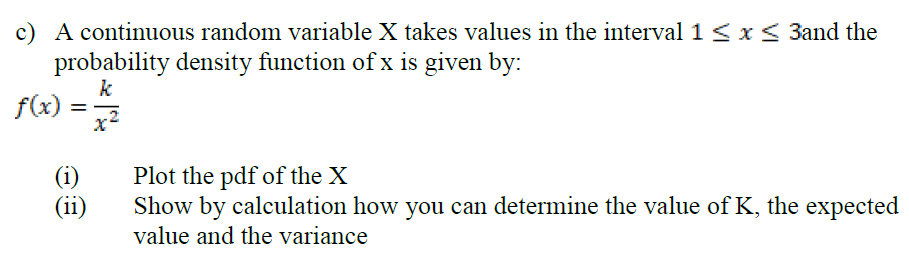
c) A continuous random variable X takes values in the interval 1 < x< 3and the probability density function of x is given by: k f(x) : x2 (i) (ii) Plot the pdf of the X Show by calculation how you can determine the value of K, the expected value and the variance
c) A continuous random variable X takes values in the interval 1 < x< 3and the probability density function of x is given by: k f(x) : x2 (i) (ii) Plot the pdf of the X Show by calculation how you can determine the value of K, the expected value and the variance

Glencoe Algebra 1, Student Edition, 9780079039897, 0079039898, 2018
18th Edition
ISBN:9780079039897
Author:Carter
Publisher:Carter
Chapter10: Statistics
Section10.1: Measures Of Center
Problem 9PPS

Related questions

Question
Transcribed Image Text:c) A continuous random variable X takes values in the interval 1 < x < 3and the
probability density function of x is given by:
k
f(x)
(i)
(ii)
Plot the pdf of the X
Show by calculation how you can determine the value of K, the expected
value and the variance
Expert Solution
This question has been solved!
Explore an expertly crafted, step-by-step solution for a thorough understanding of key concepts.

Step by step
Solved in 4 steps with 1 images

Knowledge Booster


Learn more about
Need a deep-dive on the concept behind this application? Look no further. Learn more about this topic, probability and related others by exploring similar questions and additional content below.Recommended textbooks for you
Glencoe Algebra 1, Student Edition, 9780079039897…
Algebra
ISBN:
9780079039897
Author:
Carter
Publisher:
McGraw Hill
Glencoe Algebra 1, Student Edition, 9780079039897…
Algebra
ISBN:
9780079039897
Author:
Carter
Publisher:
McGraw Hill