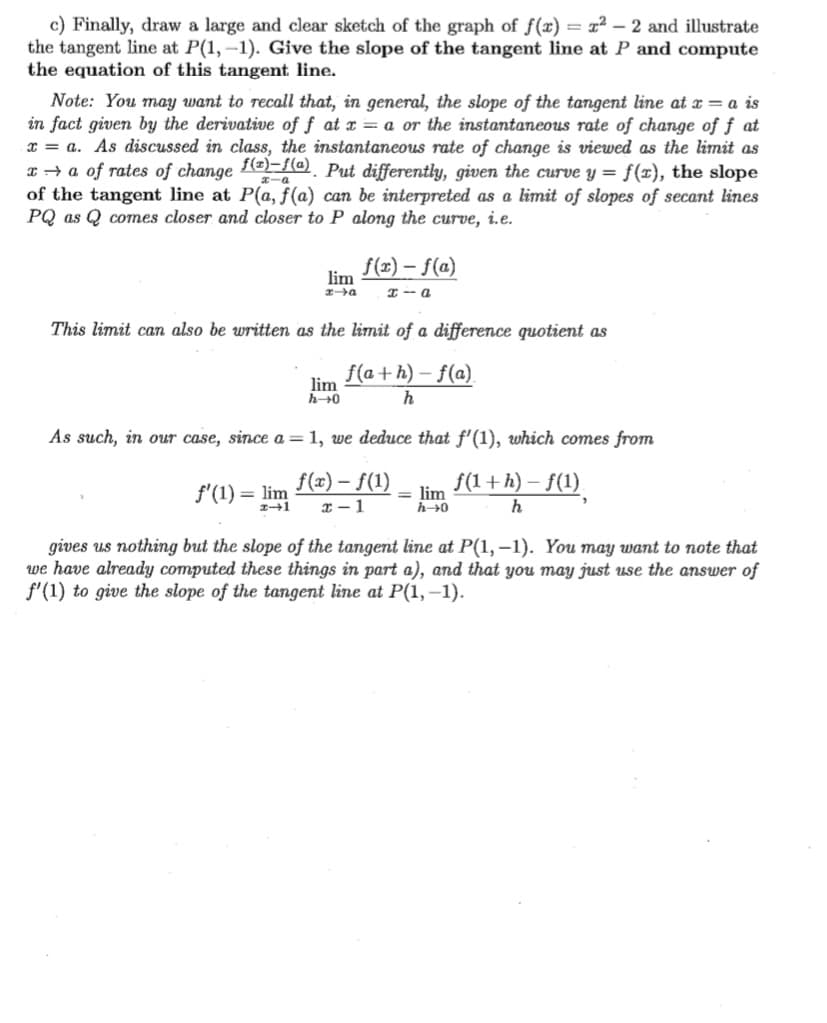
c) Finally, draw a large and clear sketch of the graph of f(x) = z² – 2 and illustrate the tangent line at P(1,-1). Give the slope of the tangent line at P and compute the equation of this tangent line.
c) Finally, draw a large and clear sketch of the graph of f(x) = z² – 2 and illustrate the tangent line at P(1,-1). Give the slope of the tangent line at P and compute the equation of this tangent line.

Trigonometry (MindTap Course List)
10th Edition
ISBN:9781337278461
Author:Ron Larson
Publisher:Ron Larson
Chapter6: Topics In Analytic Geometry
Section6.2: Introduction To Conics: parabolas
Problem 4ECP: Find an equation of the tangent line to the parabola y=3x2 at the point 1,3.

Related questions

Concept explainers
Contingency Table
A contingency table can be defined as the visual representation of the relationship between two or more categorical variables that can be evaluated and registered. It is a categorical version of the scatterplot, which is used to investigate the linear relationship between two variables. A contingency table is indeed a type of frequency distribution table that displays two variables at the same time.
Binomial Distribution
Binomial is an algebraic expression of the sum or the difference of two terms. Before knowing about binomial distribution, we must know about the binomial theorem.
Topic Video
Question
100%
Question c.
Transcribed Image Text:c) Finally, draw a large and clear sketch of the graph of f(x) = 1² – 2 and illustrate
the tangent line at P(1, -1). Give the slope of the tangent line at P and compute
the equation of this tangent line.
Note: You may want to recall that, in general, the slope of the tangent line at x = a is
in fact given by the derivative of f at x = a or the instantaneous rate of change of f at
x = a. As discussed in class, the instantaneous rate of change is viewed as the limit as
T + a of rates of change 1e-(@ Put differently, given the curve y = f(x), the slope
of the tangent line at P(a, f(a) can be interpreted as a limit of slopes of secant lines
PQ as Q comes closer and closer to P along the curve, i.e.
f(x) – f(a)
lim
I -- a
This limit can also be written as the limit of a difference quotient as
f(a+h) – f(a).
lim
h0
h
As such, in our case, since a=1, we deduce that f'(1), which comes from
f(x) – f(1)
x – 1
= lim
h0
f(1+h) – f(1).
f'(1) = lim
h
gives us nothing but the slope of the tangent line at P(1,–1). You may want to note that
we have already computed these things in part a), and that you may just use the answer of
f'(1) to give the slope of the tangent line at P(1, –1).
Expert Solution
This question has been solved!
Explore an expertly crafted, step-by-step solution for a thorough understanding of key concepts.

Step by step
Solved in 2 steps with 2 images

Knowledge Booster


Learn more about
Need a deep-dive on the concept behind this application? Look no further. Learn more about this topic, calculus and related others by exploring similar questions and additional content below.Recommended textbooks for you
Trigonometry (MindTap Course List)
Trigonometry
ISBN:
9781337278461
Author:
Ron Larson
Publisher:
Cengage Learning
Trigonometry (MindTap Course List)
Trigonometry
ISBN:
9781337278461
Author:
Ron Larson
Publisher:
Cengage Learning