(c) Table below shows a dataset of contacts: Max Temp (°C) Weight (kg) Height (cm) Company Good Friend Gender Abu 37 67 163 M Ben 37 51 154 M Good Christine 28 76 182 F Bad Dennis 29 68 159 M Good Eliza 28 99 151 Bad Farhan 38 105 184 M Good Gina 34 51 160 F Bad Hua 26 96 156 F Bad Iris 25 60 184 F Bad John 26 63 184 M Good Kelvin 27 72 167 M Bad Latifa 26 106 155 F Good Maria 36 86 185 F Bad Ning 29 105 174 M Good Based on the table below, plot any TWO(2) charts to represent the ScanvigitonatenScanner Max Temp 1. W.i..
(c) Table below shows a dataset of contacts: Max Temp (°C) Weight (kg) Height (cm) Company Good Friend Gender Abu 37 67 163 M Ben 37 51 154 M Good Christine 28 76 182 F Bad Dennis 29 68 159 M Good Eliza 28 99 151 Bad Farhan 38 105 184 M Good Gina 34 51 160 F Bad Hua 26 96 156 F Bad Iris 25 60 184 F Bad John 26 63 184 M Good Kelvin 27 72 167 M Bad Latifa 26 106 155 F Good Maria 36 86 185 F Bad Ning 29 105 174 M Good Based on the table below, plot any TWO(2) charts to represent the ScanvigitonatenScanner Max Temp 1. W.i..

Chapter5: Data Storage Technology
Section: Chapter Questions
Problem 19VE

Related questions
Question
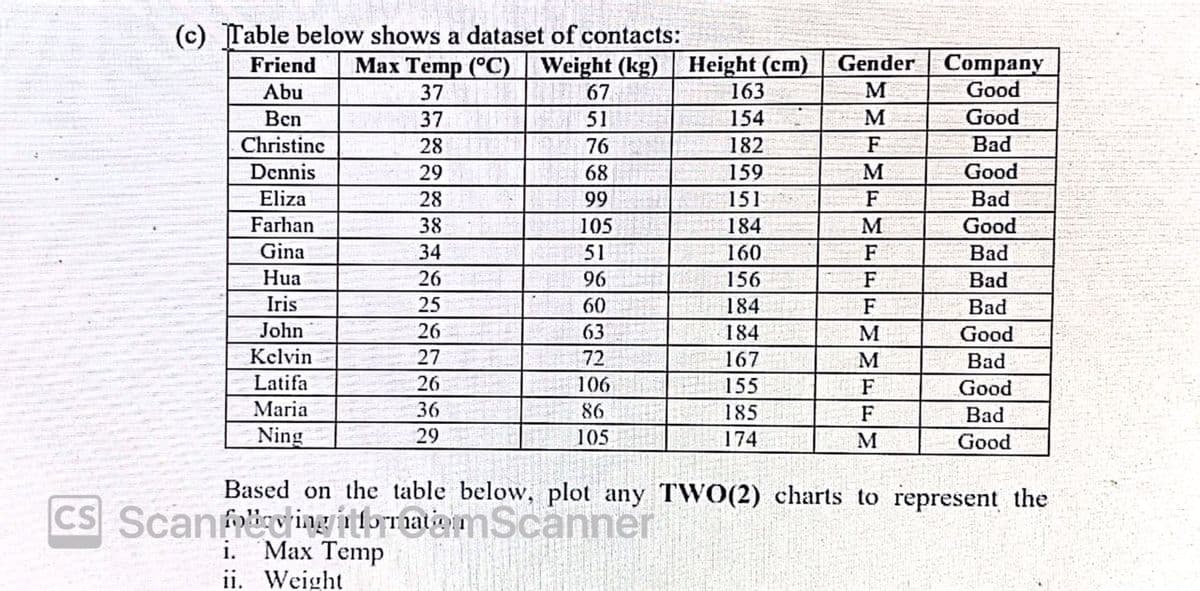
Transcribed Image Text:(c) Table below shows a dataset of contacts:
Max Temp (°C) Weight (kg)
67
Height (cm)
163
Gender Company
Good
Friend
Abu
37
M
Ben
37
51
154
M
Good
Christine
28
76
182
Bad
Dennis
29
68
159
M
Good
Eliza
28
99
151
F
Bad
Farhan
38
105
184
M
Good
Gina
34
51
160
Bad
Hua
26
96
156
F
Bad
Iris
25
60
184
Bad
John
26
63
184
M
Good
Kelvin
27
72
167
M
Bad
Latifa
26
106
155
F
Good
Maria
36
86
185
F
Bad
Ning
29
105
174
M
Good
Based on the table below, plot any TWO(2) charts to represent the
CS Scanujingifomationn Scanner
Max Temp
ii. Weight
Expert Solution
This question has been solved!
Explore an expertly crafted, step-by-step solution for a thorough understanding of key concepts.

Step by step
Solved in 4 steps with 3 images

Knowledge Booster


Learn more about
Need a deep-dive on the concept behind this application? Look no further. Learn more about this topic, computer-science and related others by exploring similar questions and additional content below.Recommended textbooks for you
Systems Architecture
Computer Science
ISBN:
9781305080195
Author:
Stephen D. Burd
Publisher:
Cengage Learning
Systems Architecture
Computer Science
ISBN:
9781305080195
Author:
Stephen D. Burd
Publisher:
Cengage Learning