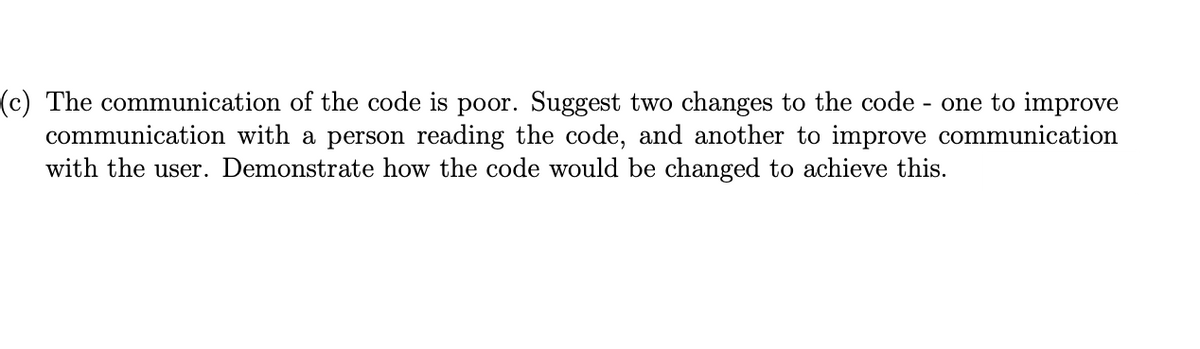
(c) The communication of the code is poor. Suggest two changes to the code - one to improve communication with a person reading the code, and another to improve communication with the user. Demonstrate how the code would be changed to achieve this.
(c) The communication of the code is poor. Suggest two changes to the code - one to improve communication with a person reading the code, and another to improve communication with the user. Demonstrate how the code would be changed to achieve this.

Computer Networking: A Top-Down Approach (7th Edition)
7th Edition
ISBN:9780133594140
Author:James Kurose, Keith Ross
Publisher:James Kurose, Keith Ross
Chapter1: Computer Networks And The Internet
Section: Chapter Questions
Problem R1RQ: What is the difference between a host and an end system? List several different types of end...

Related questions
Question
Transcribed Image Text:(c) The communication of the code is poor. Suggest two changes to the code - one to improve
communication with a person reading the code, and another to improve communication
with the user. Demonstrate how the code would be changed to achieve this.
![5. The following code relates to measurements of the concentration of paracetamol in a patient's
bloodstream after the ingestion of a 500 mg paracetamol tablet.
# Paracetamol concentration
from pylab import *
time = array([0, 0.5, 2, 6, 10, 12])
conc= array([0, 25, 34, 18, 6, 2])
plot (time, conc)
xlabel("Time (hours)")
ylabel ("Concentration (ug/mL)")
show()
total = 0
i = 1
while i < size (time):
a = (time [i] time [i-1]) * (conc[i-1] + conc[i]) / 2
print (i, a)
total total + a
i i + 1
print (total)
(a) Using the axes below (or drawing your own), create a plot of the data given in the code.
Join the data points using straight lines segments. Use the information given in the code
to ensure your graph is appropriately communicated.](/v2/_next/image?url=https%3A%2F%2Fcontent.bartleby.com%2Fqna-images%2Fquestion%2F44825f47-7947-4d58-9e56-09138ff3953c%2F39b2a032-d958-44ac-9ebf-758c7fefe0ed%2Fsho2kcf5_processed.png&w=3840&q=75)
Transcribed Image Text:5. The following code relates to measurements of the concentration of paracetamol in a patient's
bloodstream after the ingestion of a 500 mg paracetamol tablet.
# Paracetamol concentration
from pylab import *
time = array([0, 0.5, 2, 6, 10, 12])
conc= array([0, 25, 34, 18, 6, 2])
plot (time, conc)
xlabel("Time (hours)")
ylabel ("Concentration (ug/mL)")
show()
total = 0
i = 1
while i < size (time):
a = (time [i] time [i-1]) * (conc[i-1] + conc[i]) / 2
print (i, a)
total total + a
i i + 1
print (total)
(a) Using the axes below (or drawing your own), create a plot of the data given in the code.
Join the data points using straight lines segments. Use the information given in the code
to ensure your graph is appropriately communicated.
Expert Solution
This question has been solved!
Explore an expertly crafted, step-by-step solution for a thorough understanding of key concepts.

Step by step
Solved in 2 steps

Recommended textbooks for you
Computer Networking: A Top-Down Approach (7th Edi…
Computer Engineering
ISBN:
9780133594140
Author:
James Kurose, Keith Ross
Publisher:
PEARSON

Computer Organization and Design MIPS Edition, Fi…
Computer Engineering
ISBN:
9780124077263
Author:
David A. Patterson, John L. Hennessy
Publisher:
Elsevier Science

Network+ Guide to Networks (MindTap Course List)
Computer Engineering
ISBN:
9781337569330
Author:
Jill West, Tamara Dean, Jean Andrews
Publisher:
Cengage Learning
Computer Networking: A Top-Down Approach (7th Edi…
Computer Engineering
ISBN:
9780133594140
Author:
James Kurose, Keith Ross
Publisher:
PEARSON
Computer Organization and Design MIPS Edition, Fi…
Computer Engineering
ISBN:
9780124077263
Author:
David A. Patterson, John L. Hennessy
Publisher:
Elsevier Science
Network+ Guide to Networks (MindTap Course List)
Computer Engineering
ISBN:
9781337569330
Author:
Jill West, Tamara Dean, Jean Andrews
Publisher:
Cengage Learning

Concepts of Database Management
Computer Engineering
ISBN:
9781337093422
Author:
Joy L. Starks, Philip J. Pratt, Mary Z. Last
Publisher:
Cengage Learning

Prelude to Programming
Computer Engineering
ISBN:
9780133750423
Author:
VENIT, Stewart
Publisher:
Pearson Education

Sc Business Data Communications and Networking, T…
Computer Engineering
ISBN:
9781119368830
Author:
FITZGERALD
Publisher:
WILEY