The table lists fossil fuel production as a percentage of total energy production for selected years. A linear regression model for this data is (A) Draw a scatter plot of the data and a graph of the model on the same axes. O A. OB. y= - 0.22x +97.2 where x represents years after 1960 and y represents the corresponding percentage of oil imports. 100 100- Fossil Fuel Production Year Production (%) 60 C Years after 1960 1960 96 1970 1980 95 Years after 1960 94 Oc. 1990 93 2000 86 Q Q 100- 100 + 07 60 Years after 1960 Years after 1960 (B) Interpret the slope of the model. The rate of change of the percentage of oil imports with respect to time is per year. 97.2% -0.002% -441.8% -0.22%
The table lists fossil fuel production as a percentage of total energy production for selected years. A linear regression model for this data is (A) Draw a scatter plot of the data and a graph of the model on the same axes. O A. OB. y= - 0.22x +97.2 where x represents years after 1960 and y represents the corresponding percentage of oil imports. 100 100- Fossil Fuel Production Year Production (%) 60 C Years after 1960 1960 96 1970 1980 95 Years after 1960 94 Oc. 1990 93 2000 86 Q Q 100- 100 + 07 60 Years after 1960 Years after 1960 (B) Interpret the slope of the model. The rate of change of the percentage of oil imports with respect to time is per year. 97.2% -0.002% -441.8% -0.22%

Algebra and Trigonometry (MindTap Course List)
4th Edition
ISBN:9781305071742
Author:James Stewart, Lothar Redlin, Saleem Watson
Publisher:James Stewart, Lothar Redlin, Saleem Watson
Chapter1: Equations And Graphs
Section1.FOM: Focus On Modeling: Fitting Lines To Data
Problem 12P: Demand for Candy Bars In this problem you will determine a linear demand equation that describes the...

Related questions
Question
5b
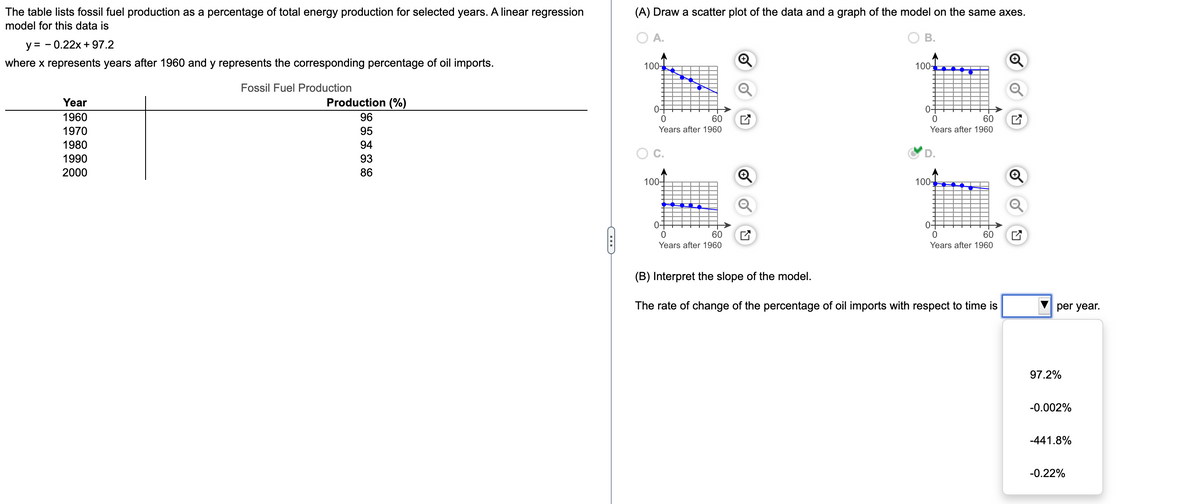
Transcribed Image Text:The table lists fossil fuel production as a percentage of total energy production for selected years. A linear regression
(A) Draw a scatter plot of the data and a graph of the model on the same axes.
model for this data is
O A.
В.
y = - 0.22x + 97.2
where x represents years after 1960 and y represents the corresponding percentage of oil imports.
100-
100-
Fossil Fuel Production
Year
Production (%)
0구
07
1960
96
60
60
1970
95
Years after 1960
Years after 1960
1980
94
C.
1990
93
2000
86
100-
100-
0구
07
60
60
Years after 1960
Years after 1960
(B) Interpret the slope of the model.
The rate of change of the percentage of oil imports with respect to time is
per year.
97.2%
-0.002%
-441.8%
-0.22%
Expert Solution
This question has been solved!
Explore an expertly crafted, step-by-step solution for a thorough understanding of key concepts.

This is a popular solution!

Trending now
This is a popular solution!

Step by step
Solved in 2 steps with 2 images

Follow-up Questions
Read through expert solutions to related follow-up questions below.
Follow-up Question
5c

Transcribed Image Text:The table lists fossil fuel production as a percentage of total energy production for selected
years. A linear regression model for this data is
(A) Draw a scatter plot of the data and a graph of the model on the same axes.
O A.
В.
y = - 0.22x + 97.2
where x represents years after 1960 and y represents the corresponding percentage of oil
imports.
100-
100-
Fossil Fuel Production
Year
Production (%)
60
60
1960
96
Years after 1960
Years after 1960
1970
95
C.
D.
1980
94
1990
93
2000
86
100-
100-
04
60
60
Years after 1960
Years after 1960
(B) Interpret the slope of the model.
The rate of change of the percentage of oil imports with respect to time is -0.22%
per
year.
(C) Use the model to predict fossil fuel production in 2010.
In 2010 fossil fuel production as a percentage of total production will be about %.
(Round to one decimal place as needed.)
Solution
Recommended textbooks for you
Algebra and Trigonometry (MindTap Course List)
Algebra
ISBN:
9781305071742
Author:
James Stewart, Lothar Redlin, Saleem Watson
Publisher:
Cengage Learning

Functions and Change: A Modeling Approach to Coll…
Algebra
ISBN:
9781337111348
Author:
Bruce Crauder, Benny Evans, Alan Noell
Publisher:
Cengage Learning

Algebra and Trigonometry (MindTap Course List)
Algebra
ISBN:
9781305071742
Author:
James Stewart, Lothar Redlin, Saleem Watson
Publisher:
Cengage Learning
Functions and Change: A Modeling Approach to Coll…
Algebra
ISBN:
9781337111348
Author:
Bruce Crauder, Benny Evans, Alan Noell
Publisher:
Cengage Learning