c. Comment on the strength of the relationship between the test scores and production ratings. The coefficient of correlation for the least-squares regression model is and the coefficient of determination is (Enter your responses rounded to three decimal places. More info Test Production Test Production Worker Worker Score Rating Score Rating A 55 43 K 58 57 38 43 75 75 93 87 M 67 48 D 86 77 N 31 26 88 82 62 49 F 66 68 24 25 G 55 47 Q 78 84 Clear all Check H 50 46 R 34 32 41 41 S 51 58 J 69 74 39 30 Print Done
c. Comment on the strength of the relationship between the test scores and production ratings. The coefficient of correlation for the least-squares regression model is and the coefficient of determination is (Enter your responses rounded to three decimal places. More info Test Production Test Production Worker Worker Score Rating Score Rating A 55 43 K 58 57 38 43 75 75 93 87 M 67 48 D 86 77 N 31 26 88 82 62 49 F 66 68 24 25 G 55 47 Q 78 84 Clear all Check H 50 46 R 34 32 41 41 S 51 58 J 69 74 39 30 Print Done

Purchasing and Supply Chain Management
6th Edition
ISBN:9781285869681
Author:Robert M. Monczka, Robert B. Handfield, Larry C. Giunipero, James L. Patterson
Publisher:Robert M. Monczka, Robert B. Handfield, Larry C. Giunipero, James L. Patterson
ChapterC: Cases
Section: Chapter Questions
Problem 5.3SD: Scenario 4 Sharon Gillespie, a new buyer at Visionex, Inc., was reviewing quotations for a tooling...

Related questions
Question
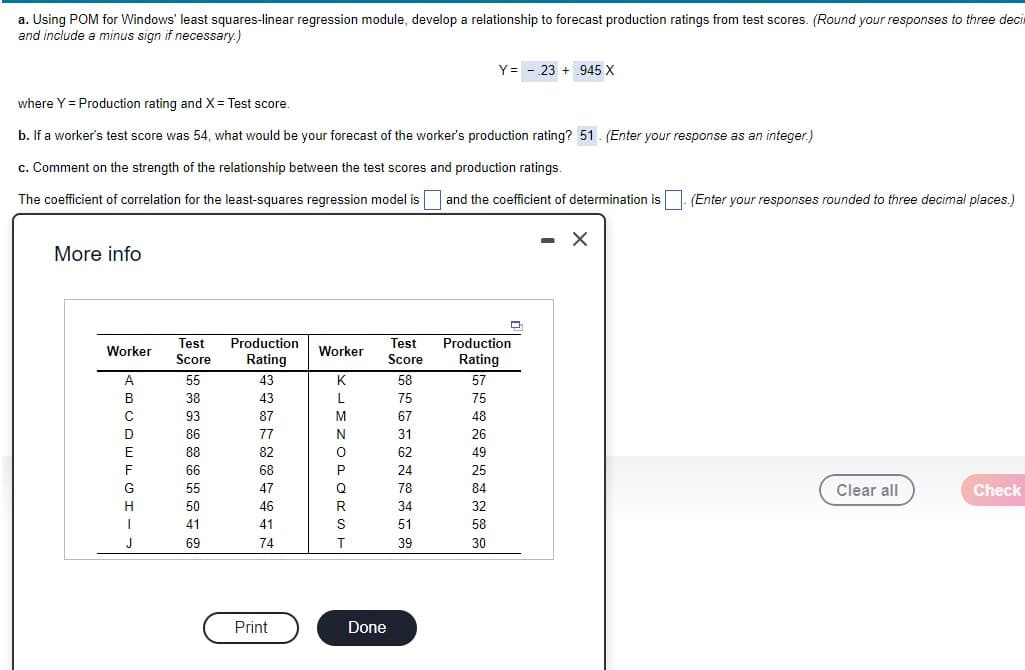
Transcribed Image Text:a. Using POM for Windows' least squares-linear regression module, develop a relationship to forecast production ratings from test scores. (Round your responses to three decis
and include a minus sign if necessary.)
Y= - 23 + .945 x
where Y = Production rating and X = Test score.
b. If a worker's test score was 54, what would be your forecast of the worker's production rating? 51. (Enter your response as an integer.)
c. Comment on the strength of the relationship between the test scores and production ratings.
The coefficient of correlation for the least-squares regression model is
and the coefficient of determination is
(Enter your responses rounded to three decimal places.)
More info
Test
Score
Production
Rating
Production
Test
Worker
Worker
Rating
Score
A
55
43
K
58
57
B
38
43
75
75
93
87
67
48
D
86
77
31
26
E
88
82
62
49
F
66
68
24
25
G
55
47
Q
78
84
Clear all
Check
50
46
34
32
41
41
51
58
J
69
74
T
39
30
Print
Done
LLMN OPoRS
Expert Solution
This question has been solved!
Explore an expertly crafted, step-by-step solution for a thorough understanding of key concepts.

This is a popular solution!

Trending now
This is a popular solution!

Step by step
Solved in 2 steps with 2 images

Recommended textbooks for you
Purchasing and Supply Chain Management
Operations Management
ISBN:
9781285869681
Author:
Robert M. Monczka, Robert B. Handfield, Larry C. Giunipero, James L. Patterson
Publisher:
Cengage Learning

Contemporary Marketing
Marketing
ISBN:
9780357033777
Author:
Louis E. Boone, David L. Kurtz
Publisher:
Cengage Learning

Marketing
Marketing
ISBN:
9780357033791
Author:
Pride, William M
Publisher:
South Western Educational Publishing
Purchasing and Supply Chain Management
Operations Management
ISBN:
9781285869681
Author:
Robert M. Monczka, Robert B. Handfield, Larry C. Giunipero, James L. Patterson
Publisher:
Cengage Learning
Contemporary Marketing
Marketing
ISBN:
9780357033777
Author:
Louis E. Boone, David L. Kurtz
Publisher:
Cengage Learning
Marketing
Marketing
ISBN:
9780357033791
Author:
Pride, William M
Publisher:
South Western Educational Publishing