C. Describe each graph for values of x such that 0 < x < 1 The graph of f (x) = log (x) lies the X-axis and approaches asymptotically as gets closer to The graph of g (x) = In (x ) lies the x-axis and approaches asymptotically as gets closer to
C. Describe each graph for values of x such that 0 < x < 1 The graph of f (x) = log (x) lies the X-axis and approaches asymptotically as gets closer to The graph of g (x) = In (x ) lies the x-axis and approaches asymptotically as gets closer to

Chapter6: Exponential And Logarithmic Functions
Section6.8: Fitting Exponential Models To Data
Problem 60SE: Use the result from the previous exercise to graph the logistic model P(t)=201+4e0.5t along with its...

Related questions
Question
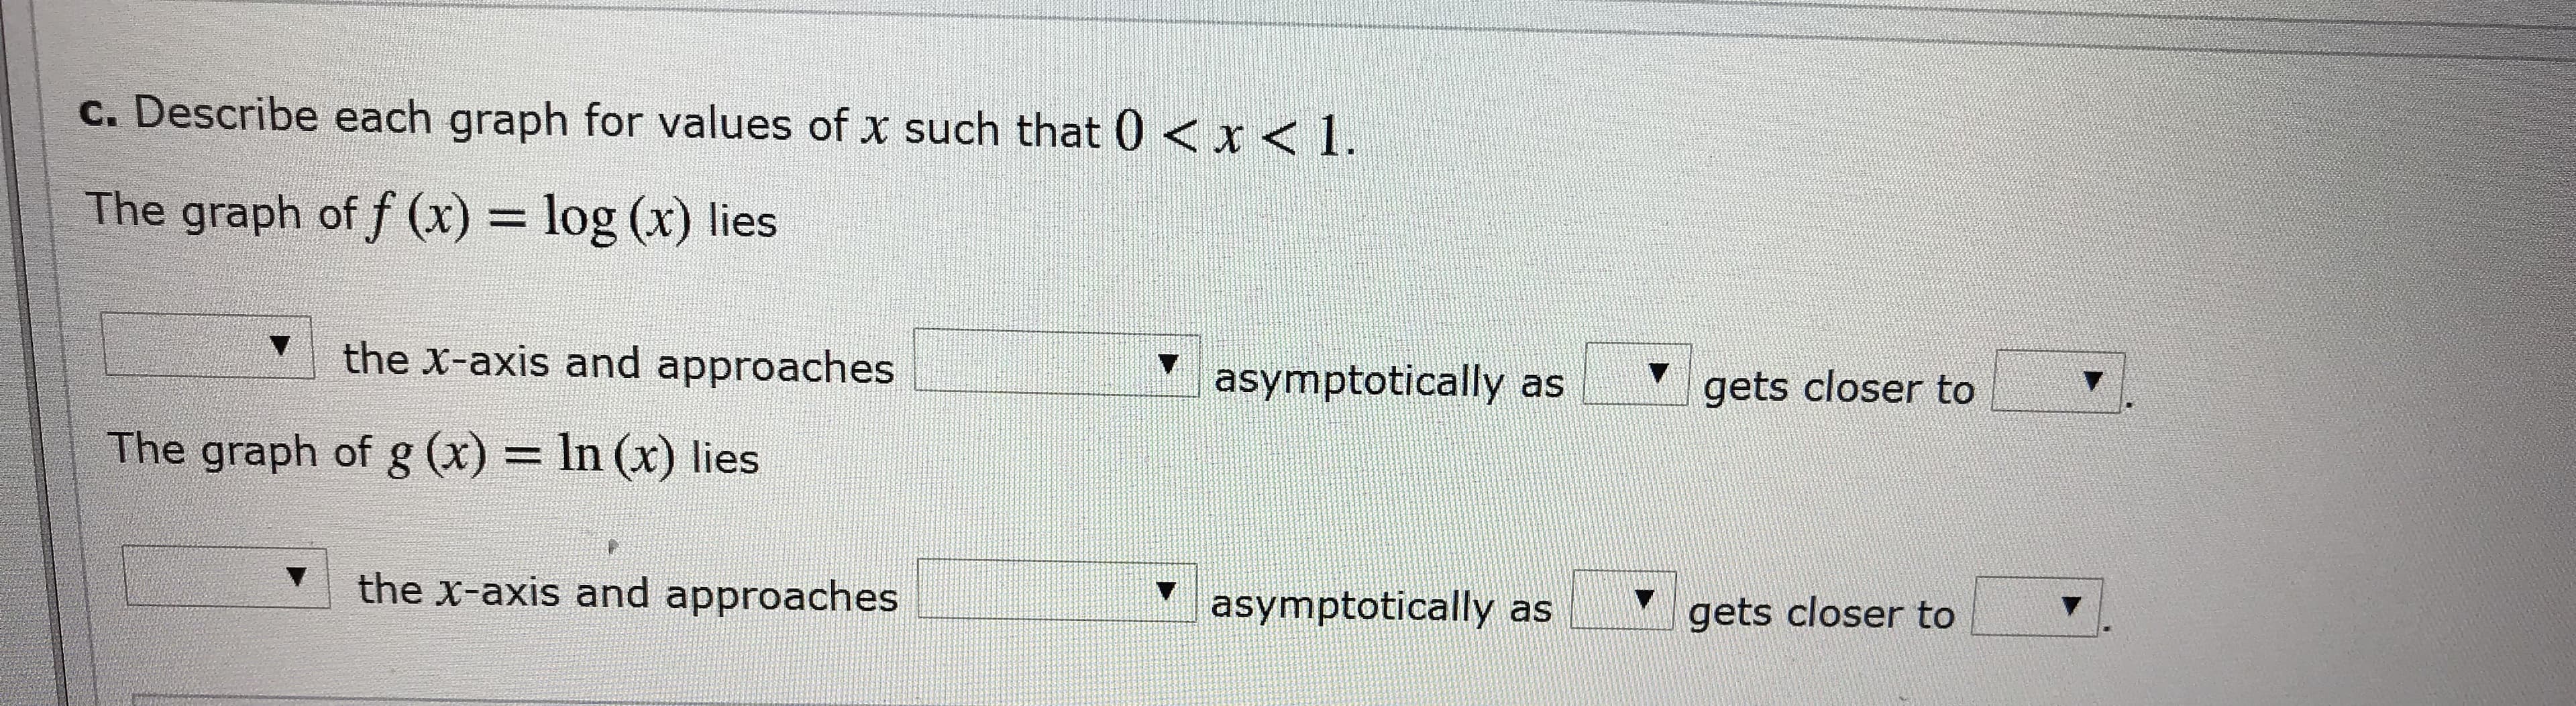
Transcribed Image Text:C. Describe each graph for values of x such that 0 < x < 1
The graph of f (x) = log (x) lies
the X-axis and approaches
asymptotically as
gets closer to
The graph of g (x) = In (x ) lies
the x-axis and approaches
asymptotically as
gets closer to
Expert Solution
This question has been solved!
Explore an expertly crafted, step-by-step solution for a thorough understanding of key concepts.

This is a popular solution!

Trending now
This is a popular solution!

Step by step
Solved in 4 steps with 4 images

Recommended textbooks for you

Trigonometry (MindTap Course List)
Trigonometry
ISBN:
9781337278461
Author:
Ron Larson
Publisher:
Cengage Learning

Trigonometry (MindTap Course List)
Trigonometry
ISBN:
9781337278461
Author:
Ron Larson
Publisher:
Cengage Learning

Algebra & Trigonometry with Analytic Geometry
Algebra
ISBN:
9781133382119
Author:
Swokowski
Publisher:
Cengage

College Algebra
Algebra
ISBN:
9781305115545
Author:
James Stewart, Lothar Redlin, Saleem Watson
Publisher:
Cengage Learning