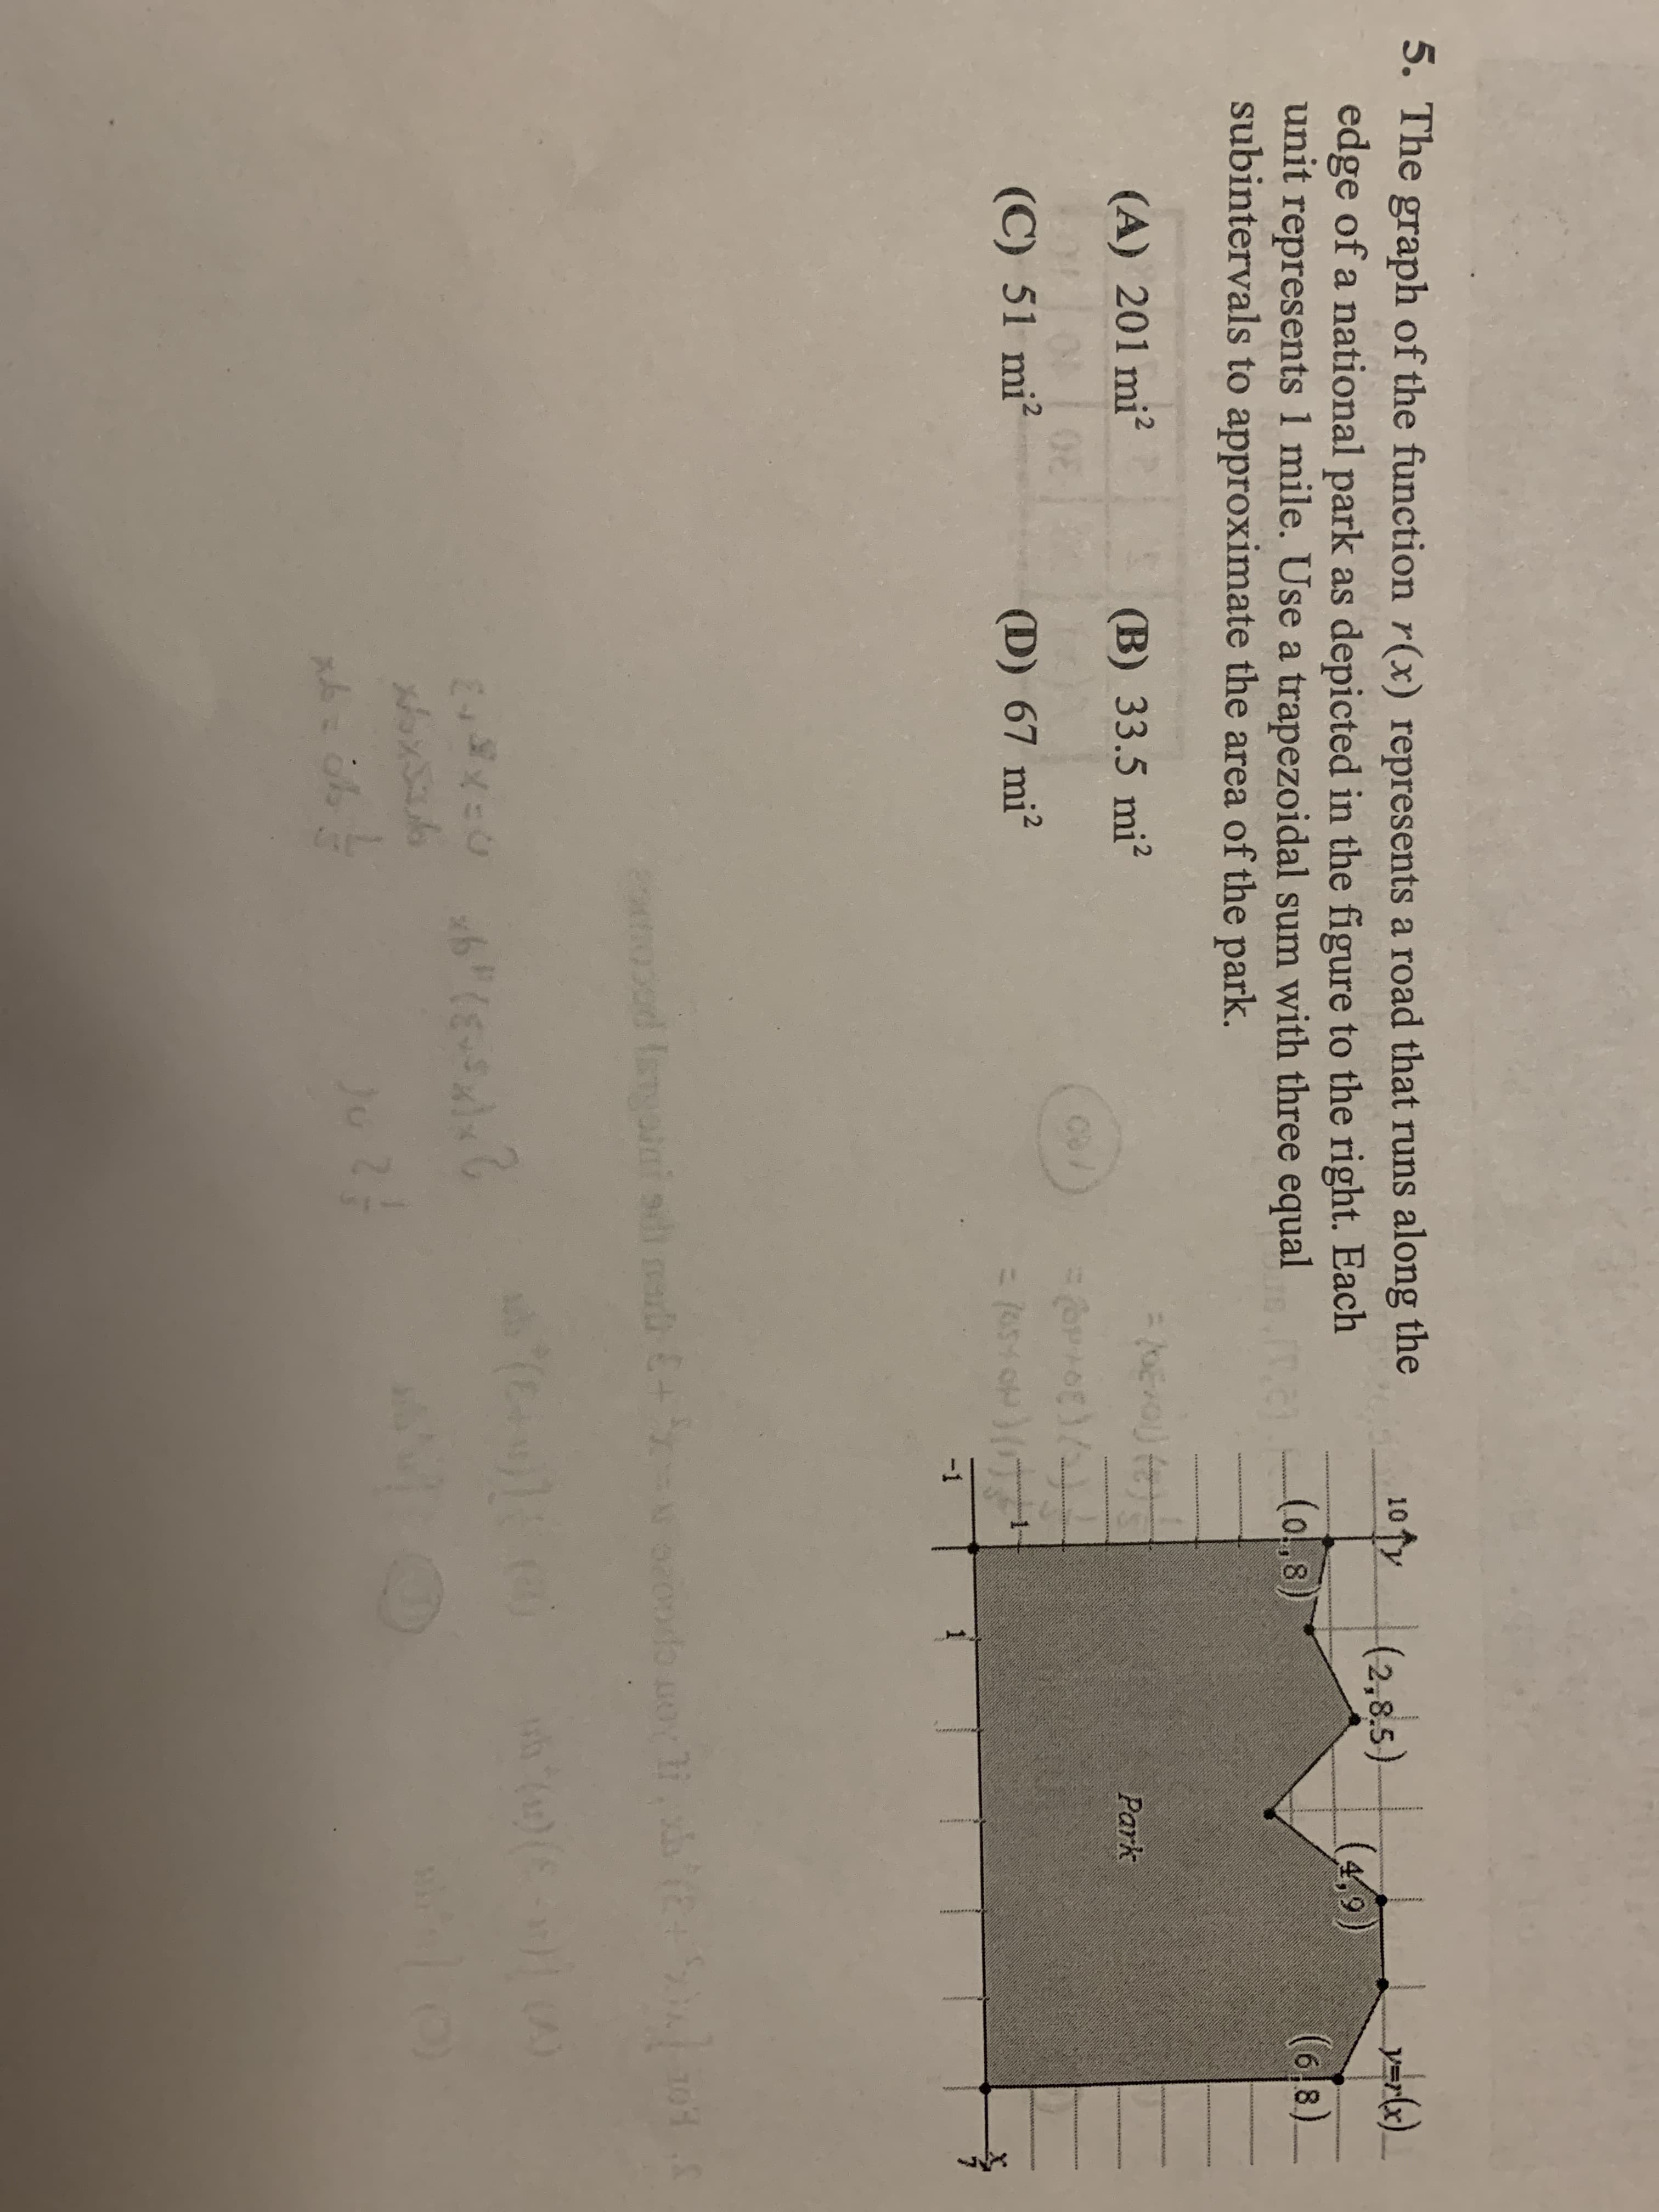
5. The graph of the function r(x) represents a road that runs along the edge of a national park as depicted in the figure to the right. Each unit represents 1 mile. Use a trapezoidal sum with three equal subintervals to approximate the area of the park. 10 y (2,8,5) y=rlx)_ (4,9) (o,8) (6,8). (A) 201 mi? (B) 33.5 mi? Park 2. (C) 51 mi² (D) 67 mi² -1 24
5. The graph of the function r(x) represents a road that runs along the edge of a national park as depicted in the figure to the right. Each unit represents 1 mile. Use a trapezoidal sum with three equal subintervals to approximate the area of the park. 10 y (2,8,5) y=rlx)_ (4,9) (o,8) (6,8). (A) 201 mi? (B) 33.5 mi? Park 2. (C) 51 mi² (D) 67 mi² -1 24

Algebra & Trigonometry with Analytic Geometry
13th Edition
ISBN:9781133382119
Author:Swokowski
Publisher:Swokowski
Chapter5: Inverse, Exponential, And Logarithmic Functions
Section5.3: The Natural Exponential Function
Problem 56E

Related questions
Question
See photo
Transcribed Image Text:5. The graph of the function r(x) represents a road that runs along the
edge of a national park as depicted in the figure to the right. Each
unit represents 1 mile. Use a trapezoidal sum with three equal
subintervals to approximate the area of the park.
10 y
(2,8,5)
y=rlx)_
(4,9)
(o,8)
(6,8).
(A) 201 mi?
(B) 33.5 mi?
Park
2.
(C) 51 mi²
(D) 67 mi²
-1
24
Expert Solution
This question has been solved!
Explore an expertly crafted, step-by-step solution for a thorough understanding of key concepts.

This is a popular solution!

Trending now
This is a popular solution!

Step by step
Solved in 2 steps with 1 images

Recommended textbooks for you
Algebra & Trigonometry with Analytic Geometry
Algebra
ISBN:
9781133382119
Author:
Swokowski
Publisher:
Cengage
Algebra & Trigonometry with Analytic Geometry
Algebra
ISBN:
9781133382119
Author:
Swokowski
Publisher:
Cengage