Calories consumed by members of a track team the day before a race are normally distributed, with a mean of 1,800 calories and a standard deviation of 100 calories. If a normal curve is sketched using these data, what is the range for 3 standard deviations to the right and to the left of the mean? 0-3,600 O1,700-1,900 1,600-2,000 1,500-2,100
Calories consumed by members of a track team the day before a race are normally distributed, with a mean of 1,800 calories and a standard deviation of 100 calories. If a normal curve is sketched using these data, what is the range for 3 standard deviations to the right and to the left of the mean? 0-3,600 O1,700-1,900 1,600-2,000 1,500-2,100

Glencoe Algebra 1, Student Edition, 9780079039897, 0079039898, 2018
18th Edition
ISBN:9780079039897
Author:Carter
Publisher:Carter
Chapter10: Statistics
Section10.4: Distributions Of Data
Problem 19PFA

Related questions
Topic Video
Question
When your trying to study
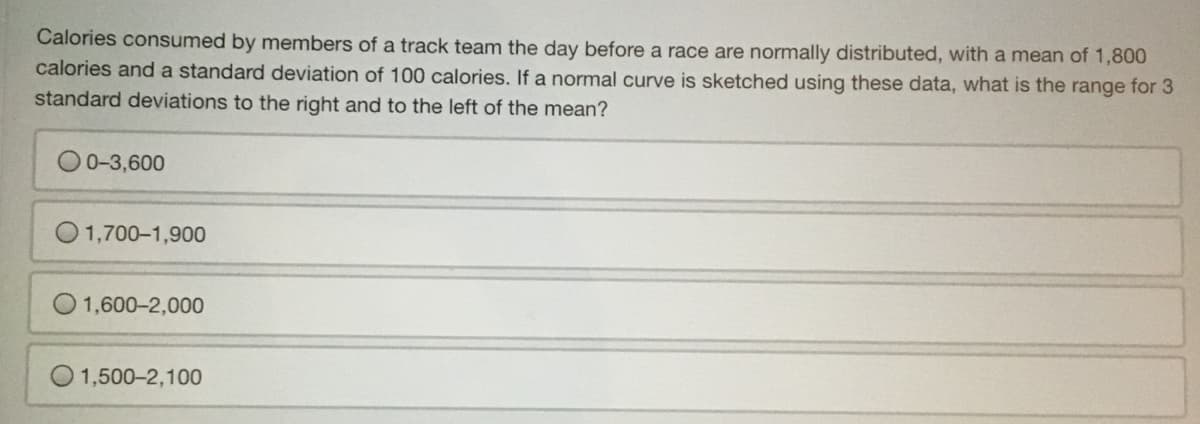
Transcribed Image Text:Calories consumed by members of a track team the day before a race are normally distributed, with a mean of 1,800
calories and a standard deviation of 100 calories. If a normal curve is sketched using these data, what is the range for 3
standard deviations to the right and to the left of the mean?
0-3,600
1,700-1,900
1,600-2,000
1,500-2,100
Expert Solution
This question has been solved!
Explore an expertly crafted, step-by-step solution for a thorough understanding of key concepts.

This is a popular solution!

Trending now
This is a popular solution!

Step by step
Solved in 2 steps with 1 images

Knowledge Booster


Learn more about
Need a deep-dive on the concept behind this application? Look no further. Learn more about this topic, probability and related others by exploring similar questions and additional content below.Recommended textbooks for you
Glencoe Algebra 1, Student Edition, 9780079039897…
Algebra
ISBN:
9780079039897
Author:
Carter
Publisher:
McGraw Hill
Glencoe Algebra 1, Student Edition, 9780079039897…
Algebra
ISBN:
9780079039897
Author:
Carter
Publisher:
McGraw Hill