Can a Company with this Financial Analysis of Data be successful with obtaining a $500.0 million loan? Justify.
Can a Company with this Financial Analysis of Data be successful with obtaining a $500.0 million loan? Justify.

Financial & Managerial Accounting
13th Edition
ISBN:9781285866307
Author:Carl Warren, James M. Reeve, Jonathan Duchac
Publisher:Carl Warren, James M. Reeve, Jonathan Duchac
Chapter15: Financial Statement Analysis
Section: Chapter Questions
Problem 15.17EX: Profitability ratios The following selected data were taken from the financial statements of...

Related questions
Question
Can a Company with this Financial Analysis of Data be successful with obtaining a $500.0 million loan? Justify.
Image Attached.
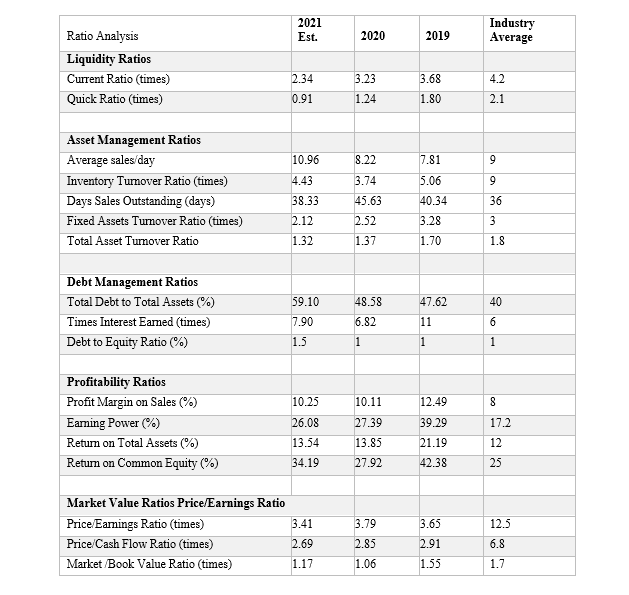
Transcribed Image Text:2021
Ratio Analysis
Industry
Average
Est.
2020
2019
Liquidity Ratios
Current Ratio (times)
2.34
3.23
3.68
4.2
Quick Ratio (times)
0.91
1.24
1.80
2.1
Asset Management Ratios
Average sales/day
10.96
8.22
7.81
Inventory Tumover Ratio (times)
4.43
3.74
5.06
Days Sales Outstanding (days)
38.33
45.63
40.34
36
Fixed Assets Turmover Ratio (times)
2.12
2.52
3.28
Total Asset Tumover Ratio
1.32
1.37
1.70
1.8
Debt Management Ratios
Total Debt to Total Assets (%)
59.10
48.58
47.62
40
Times Interest Eamed (times)
7.90
6.82
11
6
Debt to Equity Ratio (%)
1.5
1
1
1
Profitability Ratios
Profit Margin on Sales (%)
10.25
10.11
12.49
Eaming Power (%)
26.08
27.39
39.29
17.2
Retum on Total Assets (%)
13.54
13.85
21.19
12
Return on Common Equity (%)
34.19
27.92
42.38
25
Market Value Ratios Price/Earnings Ratio
Price/Eamings Ratio (times)
3.41
3.79
3.65
12.5
Price/Cash Flow Ratio (times)
2.69
2.85
2.91
6.8
Market /Book Value Ratio (times)
1.17
1.06
1.55
1.7
en
Expert Solution
This question has been solved!
Explore an expertly crafted, step-by-step solution for a thorough understanding of key concepts.

Step by step
Solved in 2 steps

Knowledge Booster


Learn more about
Need a deep-dive on the concept behind this application? Look no further. Learn more about this topic, accounting and related others by exploring similar questions and additional content below.Recommended textbooks for you
Financial & Managerial Accounting
Accounting
ISBN:
9781285866307
Author:
Carl Warren, James M. Reeve, Jonathan Duchac
Publisher:
Cengage Learning

Survey of Accounting (Accounting I)
Accounting
ISBN:
9781305961883
Author:
Carl Warren
Publisher:
Cengage Learning
Financial & Managerial Accounting
Accounting
ISBN:
9781285866307
Author:
Carl Warren, James M. Reeve, Jonathan Duchac
Publisher:
Cengage Learning
Survey of Accounting (Accounting I)
Accounting
ISBN:
9781305961883
Author:
Carl Warren
Publisher:
Cengage Learning