Cash Flows Information 2017 59,126 2018 26,487 -20,422 -28,780 6,065 2019 14,876 2020 38.537 -15,464 -10,956 23,073 2021 Operating activities CF Investing activities CF Financing activities CF Free CF Cash and cash equivalents at the year- millions of yen millions of yen millions of yen millions of yen millions of yen -4,767 -38,334 54,359 -22,113 -20,668 -7,237 -6,384 30,473 -31,492 24,089 199,208 176,566 148.064 158.617 154,540 end Capital expenditures Depreciation and amortization millions of yen millions of yen millions of yen 24,196 19,180 62.087 14,504 14,508 61.969 34,424 22,896 27,063 20,561 67,102 18,819 66,681 17,193 76,535 R&D expenses 2019 Selected Financial Data Total assets Net assets Shareholders' equity Inventories Capital expenditures Depreciation and amortization R&D expenses Total asset tumover Inventory turnover Employee 2017 2021 2018 473,467 310,456 307,951 40.573 24,196 19,180 62,087 0.7 8.0 2020 millions of yen millions of yen millions of yen millions of yen millions of yen millions of yen 464,654 305,337 302,648 50,020 34,424 18,819 66.681 0.7 6.6 521,599 311,497 307,764 458.268 296,858 294,102 47,007 22,896 17,193 76.535 0.8 7.8 421,599 291,256 290.759 47,440 27,063 20,561 67,102 0.7 7.7 52,911 14,504 14,508 61,969 0.6 5.2 millions of yen times times Number of employees Sales per employee Others employees millions of yen 7,639 48.0 7.726 41.9 7,993 41.5 8,798 41.7 7.535 36.9 ROE 9.2 2.9 0.9 4.6 0.4 ROA PER % times 5.2 12.7 1.8 44.2 0.6 115.9 1.0 3.0 22.4 1.1 0.3 318.6 PBR times 1.1 1.3 1.4 Per Share Data 2018 38.10 2019 2017 117.79 2020 58.65 58.63 1,251.02 40.00 1,315 Net income per share 2021 5.42 yen 11.27 Net income per share (Diluted) Net assets per share Cash dividends per share Stock price Others Dividends paid to net assets 117.40 1,313.06 40.00 1,492 38.04 1,313.90 40.00 11.24 1,289.32 40.00 1,306 N/A 1,236.82 30.00 1,727 yen yen yen yen 1,685 PER PBR % times times 3.1 12.7 3.0 44.2 1.3 3.1 115.9 1.0 3.1 22.4 2.4 318.6 1.4 1.1 1.1
Cash Flows Information 2017 59,126 2018 26,487 -20,422 -28,780 6,065 2019 14,876 2020 38.537 -15,464 -10,956 23,073 2021 Operating activities CF Investing activities CF Financing activities CF Free CF Cash and cash equivalents at the year- millions of yen millions of yen millions of yen millions of yen millions of yen -4,767 -38,334 54,359 -22,113 -20,668 -7,237 -6,384 30,473 -31,492 24,089 199,208 176,566 148.064 158.617 154,540 end Capital expenditures Depreciation and amortization millions of yen millions of yen millions of yen 24,196 19,180 62.087 14,504 14,508 61.969 34,424 22,896 27,063 20,561 67,102 18,819 66,681 17,193 76,535 R&D expenses 2019 Selected Financial Data Total assets Net assets Shareholders' equity Inventories Capital expenditures Depreciation and amortization R&D expenses Total asset tumover Inventory turnover Employee 2017 2021 2018 473,467 310,456 307,951 40.573 24,196 19,180 62,087 0.7 8.0 2020 millions of yen millions of yen millions of yen millions of yen millions of yen millions of yen 464,654 305,337 302,648 50,020 34,424 18,819 66.681 0.7 6.6 521,599 311,497 307,764 458.268 296,858 294,102 47,007 22,896 17,193 76.535 0.8 7.8 421,599 291,256 290.759 47,440 27,063 20,561 67,102 0.7 7.7 52,911 14,504 14,508 61,969 0.6 5.2 millions of yen times times Number of employees Sales per employee Others employees millions of yen 7,639 48.0 7.726 41.9 7,993 41.5 8,798 41.7 7.535 36.9 ROE 9.2 2.9 0.9 4.6 0.4 ROA PER % times 5.2 12.7 1.8 44.2 0.6 115.9 1.0 3.0 22.4 1.1 0.3 318.6 PBR times 1.1 1.3 1.4 Per Share Data 2018 38.10 2019 2017 117.79 2020 58.65 58.63 1,251.02 40.00 1,315 Net income per share 2021 5.42 yen 11.27 Net income per share (Diluted) Net assets per share Cash dividends per share Stock price Others Dividends paid to net assets 117.40 1,313.06 40.00 1,492 38.04 1,313.90 40.00 11.24 1,289.32 40.00 1,306 N/A 1,236.82 30.00 1,727 yen yen yen yen 1,685 PER PBR % times times 3.1 12.7 3.0 44.2 1.3 3.1 115.9 1.0 3.1 22.4 2.4 318.6 1.4 1.1 1.1

Financial Accounting: The Impact on Decision Makers
10th Edition
ISBN:9781305654174
Author:Gary A. Porter, Curtis L. Norton
Publisher:Gary A. Porter, Curtis L. Norton
Chapter7: Receivables And Investments
Section: Chapter Questions
Problem 7.11E

Related questions
Question
100%
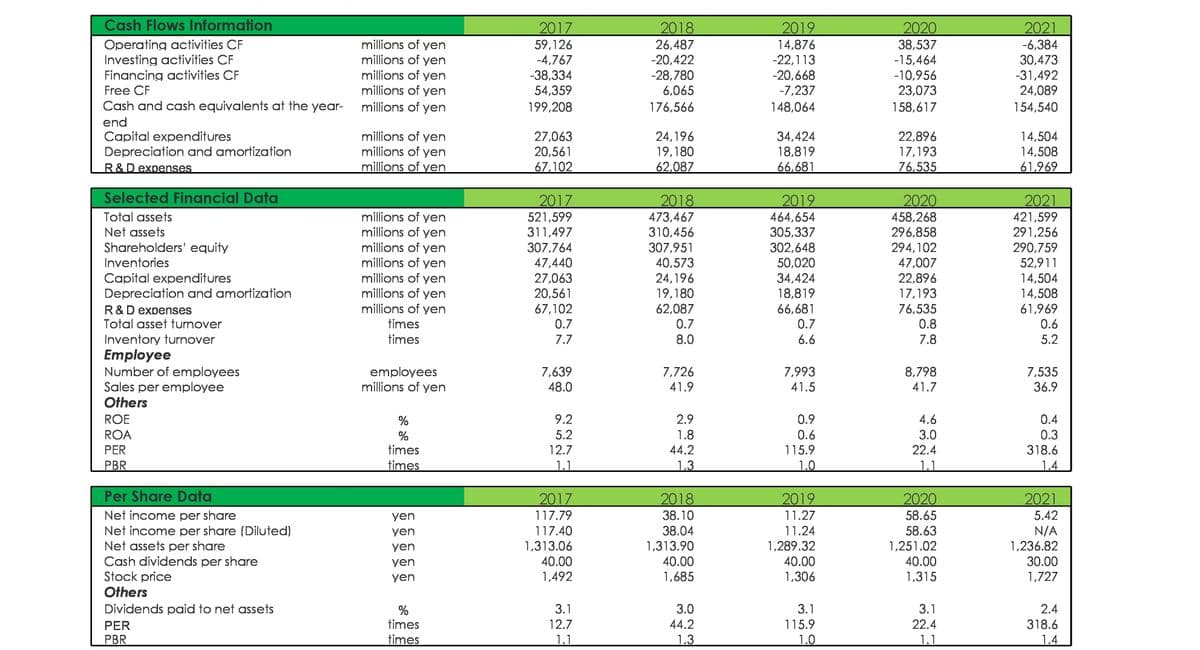
Provide a Market Share Ratio Analysis based on the Per Share Data given. (PER) and (PBR).
Transcribed Image Text:Cash Flows Information
2018
2019
14,876
-22,113
-20,668
2021
-6,384
30,473
-31,492
24,089
2017
2020
Operating activities CF
Investing activities CF
Financing activities CF
Free CF
Cash and cash equivalents at the year-
millions of yen
millions of yen
millions of yen
millions of yen
millions of yen
59,126
-4,767
-38,334
54,359
26,487
-20,422
-28,780
6,065
38,537
-15,464
-10,956
23,073
-7,237
199,208
176,566
148,064
158,617
154,540
end
millions of yen
millions of yen
millions of yen
14,504
Capital expenditures
Depreciation and amortization
27,063
20,561
67,102
24,196
19,180
62,087
34,424
18,819
66,681
22,896
17,193
76,535
14,508
R&D expenses
61,969
Selected Financial Data
2020
2017
521,599
311,497
307,764
47,440
27,063
20,561
2018
2019
2021
millions of yen
millions of yen
millions of yen
millions of yen
millions of yen
millions of yen
millions of yen
Total assets
Net assets
Shareholders' equity
Inventories
473,467
310,456
307,951
40,573
24,196
19,180
464,654
305,337
302,648
50,020
34,424
18,819
66,681
458,268
296,858
294,102
47,007
22,896
17,193
76,535
421,599
291,256
290,759
52,911
14,504
14,508
61,969
Capital expenditures
Depreciation and amortization
67,102
R&D expenses
Total asset turnover
62,087
0.7
times
0.7
0.7
0.8
0.6
Inventory turnover
Employee
Number of employees
Sales per employee
times
7.7
8.0
6.6
7.8
5.2
8,798
41.7
7,993
employees
millions of yen
7,639
48.0
7,726
41.9
7,535
36.9
41.5
Others
ROE
%
9.2
2.9
0.9
4.6
0.4
ROA
5.2
0.3
1.8
44.2
0.6
115.9
3.0
22.4
%
PER
times
12.7
318.6
PBR
times
1.1
1.3
1.0
1.1
1.4
Per Share Data
2017
2018
2019
2020
2021
Net income per share
Net income per share (Diluted)
Net assets per share
Cash dividends per share
Stock price
Others
yen
117.79
38.10
11.27
58.65
5.42
N/A
1,236.82
yen
117.40
38.04
11.24
58.63
1,313.06
1,251.02
1,313.90
40.00
1,289.32
40.00
yen
yen
40.00
40.00
30.00
yen
1,492
1,685
1,306
1,315
1,727
Dividends paid to net assets
3.1
3.0
3.1
3.1
22.4
2.4
%
times
318.6
1.4
12.7
44.2
115.9
PER
PBR
times
1.1
1.3
1.0
1.1
Expert Solution
This question has been solved!
Explore an expertly crafted, step-by-step solution for a thorough understanding of key concepts.

Step by step
Solved in 2 steps

Knowledge Booster


Learn more about
Need a deep-dive on the concept behind this application? Look no further. Learn more about this topic, accounting and related others by exploring similar questions and additional content below.Recommended textbooks for you
Financial Accounting: The Impact on Decision Make…
Accounting
ISBN:
9781305654174
Author:
Gary A. Porter, Curtis L. Norton
Publisher:
Cengage Learning

Cornerstones of Financial Accounting
Accounting
ISBN:
9781337690881
Author:
Jay Rich, Jeff Jones
Publisher:
Cengage Learning
Financial Accounting: The Impact on Decision Make…
Accounting
ISBN:
9781305654174
Author:
Gary A. Porter, Curtis L. Norton
Publisher:
Cengage Learning
Cornerstones of Financial Accounting
Accounting
ISBN:
9781337690881
Author:
Jay Rich, Jeff Jones
Publisher:
Cengage Learning