Cash-Value Option | $3.46 million 0 1 2 3 4 5 6 7 25 Years Annual-Payment Option $357,000 $196,000 G = $7,000 $189,000 $175,000 0 1 2 3 4 5 6 7 25 Years Figure 2.29 Cash flow diagram

Essentials Of Investments
11th Edition
ISBN:9781260013924
Author:Bodie, Zvi, Kane, Alex, MARCUS, Alan J.
Publisher:Bodie, Zvi, Kane, Alex, MARCUS, Alan J.
Chapter1: Investments: Background And Issues
Section: Chapter Questions
Problem 1PS
icon
Related questions
Question

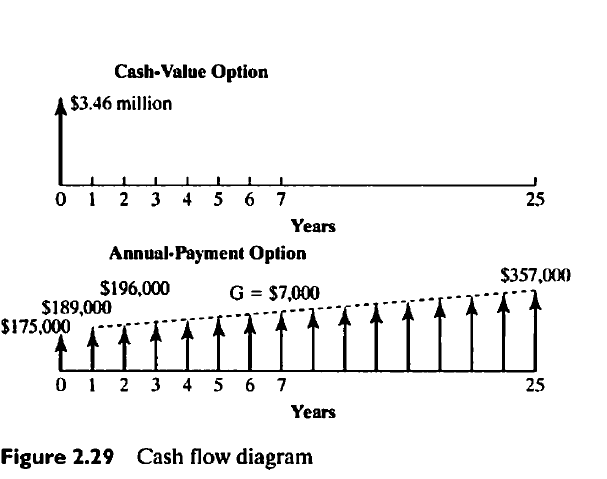
So, what could be better than winning a SuperLotto Plus jackpot? Choosing how to receive your winnings! Before playing a SuperLotto Plus jackpot, you have a choice between getting the entire jackpot in 26 annual graduated payments or receiving one lump sum that will be less than the announced jackpot. (See Figure 2.29.) What would these choices come out to for an announced jackpot of $7 million?
• Lump-sum cash-value option: The winner would receive the present cash value of the announced jackpot in one lump sum. In this case, the winner would receive about 49.43%, or $3.46 million, in one lump sum (less tax withholdings).This cash value is based on average market costs determined by U.S. Treasury zero-coupon bonds with 5.3383% annual yield.
• Annual-payments option: The winner would receive the jackpot in 26 graduated annual payments. In this case, the winner would receive $175,000 as the first payment (2.5% of the total jackpot amount) immediately. The second payment would be $189,000. Over the course of the next 25 years, these payments would gradually increase each year by $7,000 to a final payment of $357,000.
If the U.S. Treasury zero-coupon rate is reduced to 4.5% (instead of 5.338%) at the time of winning, what would be the equivalent cash value of the lottery?

Cash-Value Option
| $3.46 million
0 1 2 3 4 5 6 7
25
Years
Annual-Payment Option
$357,000
$196,000
G = $7,000
$189,000
$175,000
0 1 2 3 4 5 6 7
25
Years
Figure 2.29 Cash flow diagram
Transcribed Image Text:Cash-Value Option | $3.46 million 0 1 2 3 4 5 6 7 25 Years Annual-Payment Option $357,000 $196,000 G = $7,000 $189,000 $175,000 0 1 2 3 4 5 6 7 25 Years Figure 2.29 Cash flow diagram
Expert Solution
trending now

Trending now

This is a popular solution!

steps

Step by step

Solved in 4 steps

Blurred answer
Knowledge Booster
Present Value
Learn more about
Need a deep-dive on the concept behind this application? Look no further. Learn more about this topic, finance and related others by exploring similar questions and additional content below.
Similar questions
  • SEE MORE QUESTIONS
Recommended textbooks for you
Essentials Of Investments
Finance
ISBN:
9781260013924
Author:
Bodie, Zvi, Kane, Alex, MARCUS, Alan J.
Publisher:
Mcgraw-hill Education,
FUNDAMENTALS OF CORPORATE FINANCE
Finance
ISBN:
9781260013962
Author:
BREALEY
Publisher:
RENT MCG
Financial Management: Theory & Practice
Finance
ISBN:
9781337909730
Author:
Brigham
Publisher:
Cengage
Foundations Of Finance
Finance
ISBN:
9780134897264
Author:
KEOWN, Arthur J., Martin, John D., PETTY, J. William
Publisher:
Pearson,
Fundamentals of Financial Management (MindTap Cou…
Finance
ISBN:
9781337395250
Author:
Eugene F. Brigham, Joel F. Houston
Publisher:
Cengage Learning
Corporate Finance (The Mcgraw-hill/Irwin Series i…
Finance
ISBN:
9780077861759
Author:
Stephen A. Ross Franco Modigliani Professor of Financial Economics Professor, Randolph W Westerfield Robert R. Dockson Deans Chair in Bus. Admin., Jeffrey Jaffe, Bradford D Jordan Professor
Publisher:
McGraw-Hill Education