


Contingency Table
A contingency table can be defined as the visual representation of the relationship between two or more categorical variables that can be evaluated and registered. It is a categorical version of the scatterplot, which is used to investigate the linear relationship between two variables. A contingency table is indeed a type of frequency distribution table that displays two variables at the same time.
Binomial Distribution
Binomial is an algebraic expression of the sum or the difference of two terms. Before knowing about binomial distribution, we must know about the binomial theorem.
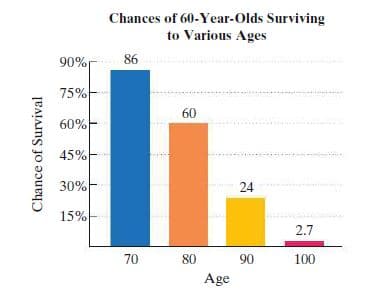
The bar graph shows your chances of surviving to various ages once you reach 60.The functions f(x) = -2.9x + 286 and g(x) = 0.01x2 - 4.9x + 370 model the chance, as a percent, that a 60-year-old will survive to age x.
a. Find and interpret f(90).
b. Find and interpret g(90).
c. Which function serves as a better model for the chance of surviving to age 90?


Trending now
This is a popular solution!

Step by step
Solved in 3 steps with 2 images


