ci When x9, y= 0. ii As the values of x increase, the corresponding values of y decrease. ii The vertical line x-7 intersects this graph once. Varation from 37'C) 45 35 8642 di The line y= 0 cuts the graph of this 32 24 25 function twice. I There are two values of x for which 2 i y=2. 1.5 il As the values of x increase, so do the corresponding values of y. ei The line y 0.5 intersects the graph 0.5 of this function twice. 02 04 0.6 O8 1 12 14 16 18 2 I The line y= 1.5 intersects the graph of this function twice. i The value x= 2 has no image. 6 Find the domain of cach of these functions if it is known that the range is (-3, -2, -1, 0, 1, 2). Times in hours since application started to work a State whether or not the relation represented in the graph is a function, giving the reason for your answer. b State the domain and the range. i -2 0 2 4 6 R 10 2 Explain their meaning in the context of the problem. e Write down the missing coordinate for each ordered pair from the graph: (0.2.). (0.8.).2). (2.). d State the temperature of the person at the start of the application. e After how many hours was the temperature of this person equal to 37°C? f During what period of time did the temperature of the person increase? Over what period did it decrease? • x-2r +1 8 642 o 4 6 8 c y--x+2 7 A special application measures the temperature of a person and records on a graph its variation from 37°C, considered to be the average optimum temperature. The application stops working when the temperature of the person is optimum. -2 -4 5 Determine whether these statements about the functions in question 4 are true or false. ai The point (-3, 2) lies on the graph of this function. i The image of x=-2 is y= 3. i When x-4, y= 0. bi The graph of this function crosses the X-axis at (-2, 0). -10 For a function f, the notation y fix) means that.x (an element of the domain, the input) is mapped through the function / to y (an element of the range, the output). 4 Find the domain and range of each of these functions. Note that: • fx) is read "f of x. • If y= fix) then x is said to be the independent variable and y is the dependent variable. • Different variables and names can be used for functions, such as d3Dvit), m= C(n), etc. HINT ii The point (o,-1) does not lie on the graph of this function. ii There is only one value of x for which y=-2. Be careful! fix) does not mean "f times.x. 216 217 Number and algebra Functions
ci When x9, y= 0. ii As the values of x increase, the corresponding values of y decrease. ii The vertical line x-7 intersects this graph once. Varation from 37'C) 45 35 8642 di The line y= 0 cuts the graph of this 32 24 25 function twice. I There are two values of x for which 2 i y=2. 1.5 il As the values of x increase, so do the corresponding values of y. ei The line y 0.5 intersects the graph 0.5 of this function twice. 02 04 0.6 O8 1 12 14 16 18 2 I The line y= 1.5 intersects the graph of this function twice. i The value x= 2 has no image. 6 Find the domain of cach of these functions if it is known that the range is (-3, -2, -1, 0, 1, 2). Times in hours since application started to work a State whether or not the relation represented in the graph is a function, giving the reason for your answer. b State the domain and the range. i -2 0 2 4 6 R 10 2 Explain their meaning in the context of the problem. e Write down the missing coordinate for each ordered pair from the graph: (0.2.). (0.8.).2). (2.). d State the temperature of the person at the start of the application. e After how many hours was the temperature of this person equal to 37°C? f During what period of time did the temperature of the person increase? Over what period did it decrease? • x-2r +1 8 642 o 4 6 8 c y--x+2 7 A special application measures the temperature of a person and records on a graph its variation from 37°C, considered to be the average optimum temperature. The application stops working when the temperature of the person is optimum. -2 -4 5 Determine whether these statements about the functions in question 4 are true or false. ai The point (-3, 2) lies on the graph of this function. i The image of x=-2 is y= 3. i When x-4, y= 0. bi The graph of this function crosses the X-axis at (-2, 0). -10 For a function f, the notation y fix) means that.x (an element of the domain, the input) is mapped through the function / to y (an element of the range, the output). 4 Find the domain and range of each of these functions. Note that: • fx) is read "f of x. • If y= fix) then x is said to be the independent variable and y is the dependent variable. • Different variables and names can be used for functions, such as d3Dvit), m= C(n), etc. HINT ii The point (o,-1) does not lie on the graph of this function. ii There is only one value of x for which y=-2. Be careful! fix) does not mean "f times.x. 216 217 Number and algebra Functions

Functions and Change: A Modeling Approach to College Algebra (MindTap Course List)
6th Edition
ISBN:9781337111348
Author:Bruce Crauder, Benny Evans, Alan Noell
Publisher:Bruce Crauder, Benny Evans, Alan Noell
Chapter2: Graphical And Tabular Analysis
Section2.2: Graphs
Problem 21E

Related questions
Question
NEED FULLY CORRECT HANDWRITTEN SOLUTION FOR THIS ASAP!!!
Do only 5th question!!!!
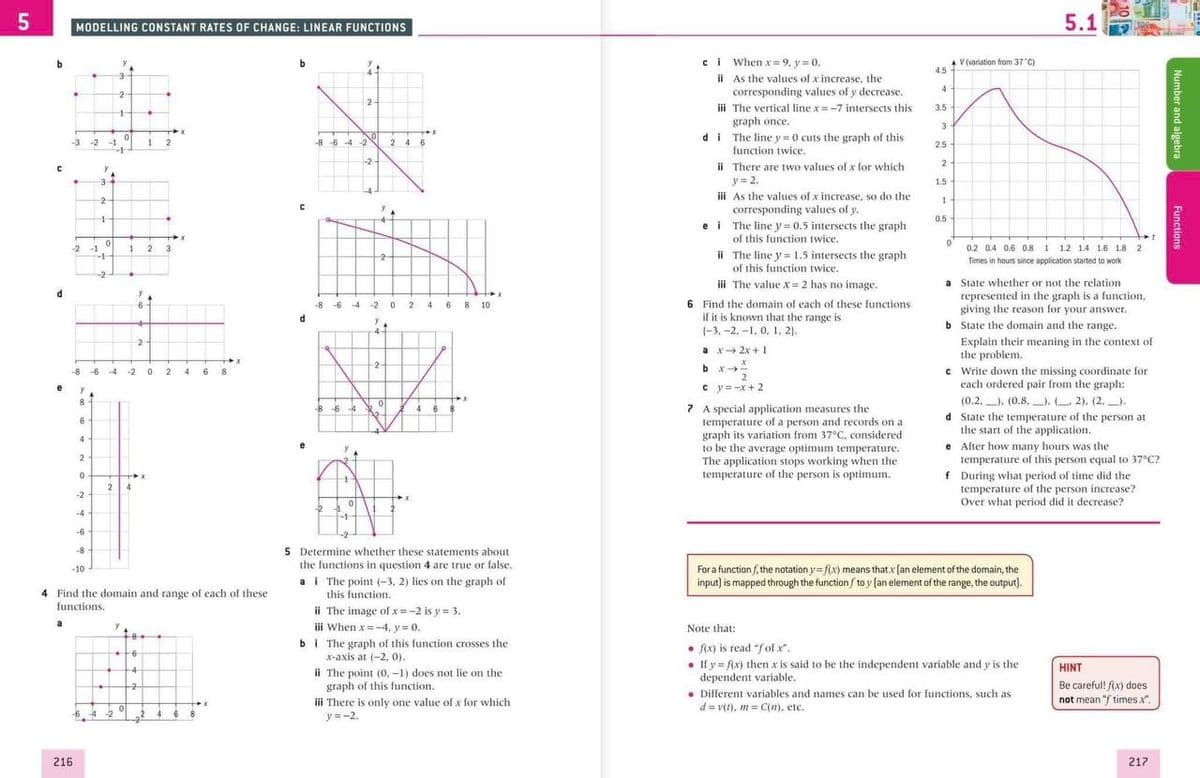
Transcribed Image Text:MODELLING CONSTANT RATES OF CHANGE: LINEAR FUNCTIONS
5.1
ci When x= 9, y = 0.
ii As the values of x increase, the
corresponding values of y decrease.
iii The vertical line x=-7 intersects this
graph once.
di The line y = 0 cuts the graph of this
function twice.
A V(variation from 37 C)
4.5
b
4
-2-
2
3.5
3
-3 -2
8 -6 -4 -2
-1
-1
2.5
-2
ii There are two values of x for which
2
y= 2.
ii As the values of x increase, so do the
corresponding values of y.
1.5
0.5
0.5
ei The line y= 0.5 intersects the graph
of this function twice.
-2
-1
2
3
0.2 0.4 0.6 0.8 1 1.2 1.4 1.6 18 2
ii The line y = 1.5 intersects the graph
of this function twice.
Times in hours since application started to work
-2
i The value x= 2 has no image.
a State whether or not the relation
represented in the graph is a function,
giving the reason for your answer.
b State the domain and the range.
2 4 6 8 10
6 Find the domain of each of these functions
if it is known that the range is
1-3, -2, -1, 0, 1, 2).
-8 -6
-4
-2
Explain their meaning in the context of
the problem.
c Write down the missing coordinate for
cach ordered pair from the graph:
2
a x 2x +1
>
2
-8 -6
4
-2
0 2
4 6
8
b x
c y= -x+ 2
(0.2.), (0.8,). 2), (2, ).
d State the temperature of the person at
the start of the application.
e After how many hours was the
temperature of this person equal to 37°C?
f During what period of time did the
temperature of the person increase?
Over what period did it decrease?
8.
7 A special application measures the
temperature of a person and records on a
graph its variation from 37°C, considered
to be the average optimum temperature.
The application stops working when the
temperature of the person is optimum.
B64
6
4
2
2
4
-2
-4
-6
5 Determine whether these statements about
the functions in question 4 are true or false.
-8
For a function f, the notation y=f(x) means that x (an element of the domain, the
input) is mapped through the function / to y (an element of the range, the output).
-10
a i The point (-3, 2) lies on the graph of
this function.
4 Find the domain and range of each of these
functions.
ii The image of x =-2 is y = 3.
iii When x=-4, y= 0.
bi The graph of this function crosses the
x-axis at (-2, 0).
ii The point (0, -1) does not lie on the
graph of this function.
Note that:
• fix) is read "f of x".
• If y = f(x) then x is said to be the independent variable and y is the
dependent variable.
• Different variables and names can be used for functions, such as
d = v(t), m C(n), etc.
HINT
Be careful! fx) does
not mean "f times x.
-2
0.
-2
iii There is only one value of x for which
y=-2.
-6.4
216
217
Number and algebra
Functions
Expert Solution
This question has been solved!
Explore an expertly crafted, step-by-step solution for a thorough understanding of key concepts.

This is a popular solution!

Trending now
This is a popular solution!

Step by step
Solved in 6 steps with 5 images

Recommended textbooks for you
Functions and Change: A Modeling Approach to Coll…
Algebra
ISBN:
9781337111348
Author:
Bruce Crauder, Benny Evans, Alan Noell
Publisher:
Cengage Learning


Algebra & Trigonometry with Analytic Geometry
Algebra
ISBN:
9781133382119
Author:
Swokowski
Publisher:
Cengage
Functions and Change: A Modeling Approach to Coll…
Algebra
ISBN:
9781337111348
Author:
Bruce Crauder, Benny Evans, Alan Noell
Publisher:
Cengage Learning
Algebra & Trigonometry with Analytic Geometry
Algebra
ISBN:
9781133382119
Author:
Swokowski
Publisher:
Cengage

Big Ideas Math A Bridge To Success Algebra 1: Stu…
Algebra
ISBN:
9781680331141
Author:
HOUGHTON MIFFLIN HARCOURT
Publisher:
Houghton Mifflin Harcourt

College Algebra
Algebra
ISBN:
9781305115545
Author:
James Stewart, Lothar Redlin, Saleem Watson
Publisher:
Cengage Learning

Trigonometry (MindTap Course List)
Trigonometry
ISBN:
9781337278461
Author:
Ron Larson
Publisher:
Cengage Learning