Click the icon to view the table of critical t-values. OC. One can be confident that the all cities have a travel tax between S D. There is a % probability that the mean travel tax for all cities is between (e) What would you recommend to a researcher who wants to increase the precision of the interval, but pes not have access to A. The researcher could increase the sample mean OB. The researcher could increase the level of confidence OC. The researcher could decrease the level of confidence. 00. The researcher could decrease the sample standard deviation. onal data?
Click the icon to view the table of critical t-values. OC. One can be confident that the all cities have a travel tax between S D. There is a % probability that the mean travel tax for all cities is between (e) What would you recommend to a researcher who wants to increase the precision of the interval, but pes not have access to A. The researcher could increase the sample mean OB. The researcher could increase the level of confidence OC. The researcher could decrease the level of confidence. 00. The researcher could decrease the sample standard deviation. onal data?

A First Course in Probability (10th Edition)
10th Edition
ISBN:9780134753119
Author:Sheldon Ross
Publisher:Sheldon Ross
Chapter1: Combinatorial Analysis
Section: Chapter Questions
Problem 1.1P: a. How many different 7-place license plates are possible if the first 2 places are for letters and...

Related questions
Question
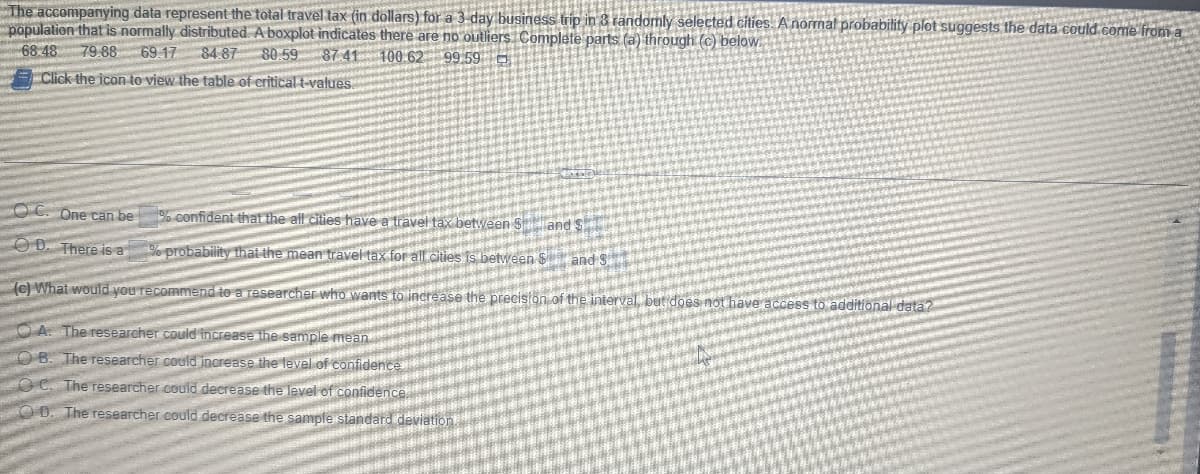
Transcribed Image Text:The accompanying data represent the total travel tax (in dollars) for a 3-day business trip in 3 randomly selected cities. A normal probability plot suggests the data could come from a
population that is normally distributed A boxplot indicates there are no outliers Complete parts (a) through (c) below.
68 48 79 88 69.17 84.87 80.59 87.41 100.62 99.59
Click the icon to view the table of critical t-values.
OC. One can be
% confident that the all cities have a travel tax between
OD. There is a
% probability that the mean travel tax for all cities
(e) What would you recommend to a researcher who wants to increase the precision of
OA. The researcher could increase the sample mean
B. The researcher could increase the level of confidence
OC. The researcher could decrease the level of confidence.
D. The researcher could decrease the sample standard deviation
d
access to additional data?
Expert Solution
This question has been solved!
Explore an expertly crafted, step-by-step solution for a thorough understanding of key concepts.

Step by step
Solved in 2 steps

Recommended textbooks for you
A First Course in Probability (10th Edition)
Probability
ISBN:
9780134753119
Author:
Sheldon Ross
Publisher:
PEARSON

A First Course in Probability (10th Edition)
Probability
ISBN:
9780134753119
Author:
Sheldon Ross
Publisher:
PEARSON