Coach Davis has three different groups of athletes training with him this summer. He has promised each group a treat if no one misses a workout session. He has asked each group which type of treat they prefer. The results are shown in the table below. Sketch a side by side bar graph of the data bar graph. Group Blue Group Red Group Green Group 19 18 17 16 15 On the graph are points that you can raise and lower to draw the bars, move these points accordingly in order to sketch the bar graph. The blue bar should represent the Blue Group; the red bar the Red Group; and the green bar the Green Group. 14 13 12 11 10 9 8 7 4321SSL 6 Ice Cream 5 10 7 5 Pizza 7 10 8 Ice Cream Pizza
Coach Davis has three different groups of athletes training with him this summer. He has promised each group a treat if no one misses a workout session. He has asked each group which type of treat they prefer. The results are shown in the table below. Sketch a side by side bar graph of the data bar graph. Group Blue Group Red Group Green Group 19 18 17 16 15 On the graph are points that you can raise and lower to draw the bars, move these points accordingly in order to sketch the bar graph. The blue bar should represent the Blue Group; the red bar the Red Group; and the green bar the Green Group. 14 13 12 11 10 9 8 7 4321SSL 6 Ice Cream 5 10 7 5 Pizza 7 10 8 Ice Cream Pizza

Glencoe Algebra 1, Student Edition, 9780079039897, 0079039898, 2018
18th Edition
ISBN:9780079039897
Author:Carter
Publisher:Carter
Chapter2: Linear Equations
Section: Chapter Questions
Problem 2PFA

Related questions
Question
100%
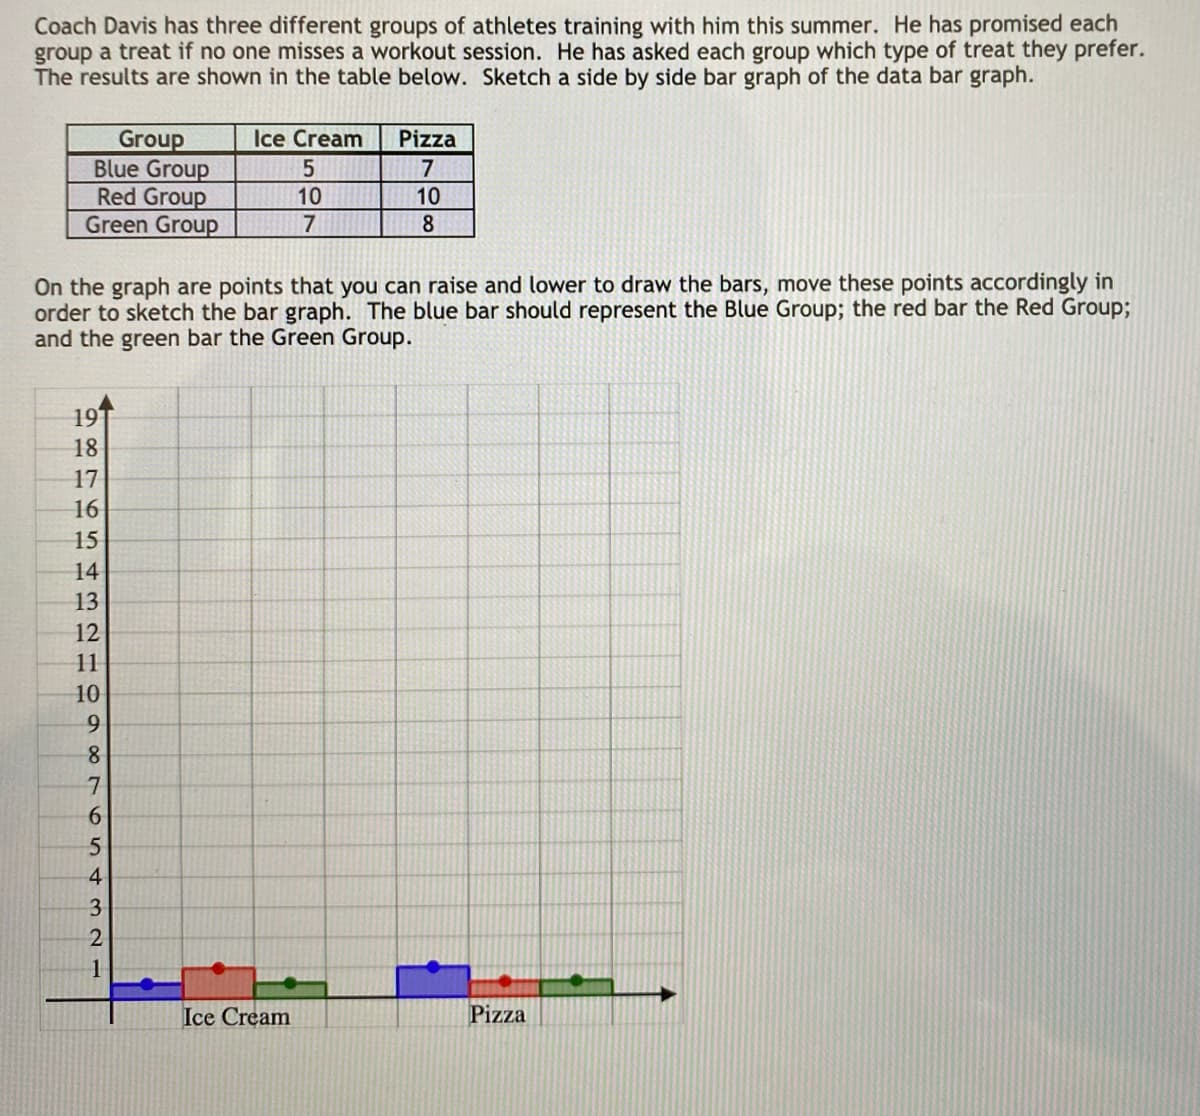
Transcribed Image Text:Coach Davis has three different groups of athletes training with him this summer. He has promised each
group a treat if no one misses a workout session. He has asked each group which type of treat they prefer.
The results are shown in the table below. Sketch a side by side bar graph of the data bar graph.
Group
Blue Group
Red Group
Green Group
19
18
17
16
15
14
13
12
11
10
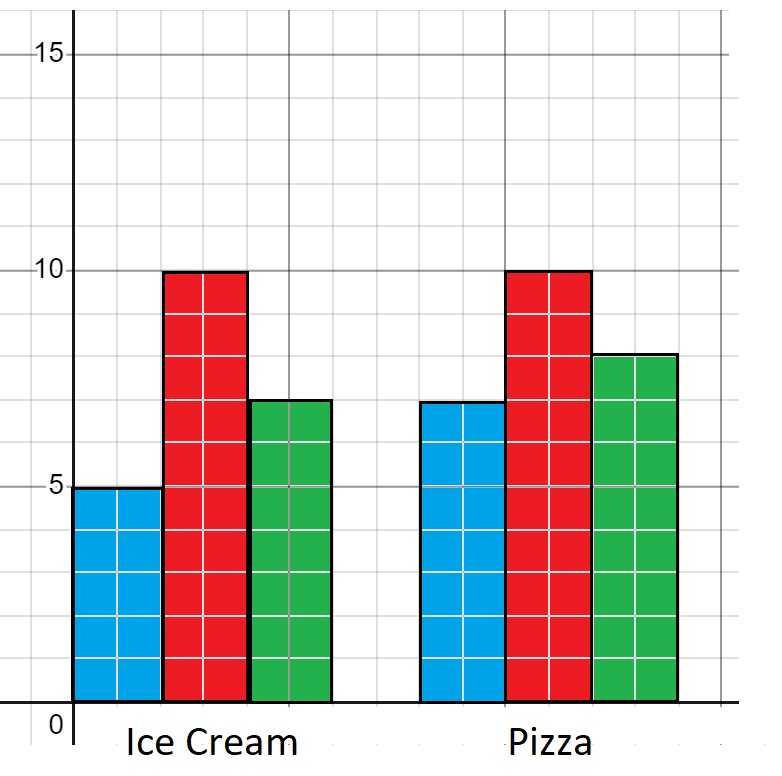
On the graph are points that you can raise and lower to draw the bars, move these points accordingly in
order to sketch the bar graph. The blue bar should represent the Blue Group; the red bar the Red Group;
and the green bar the Green Group.
9
8
7
6
654321
4
2
Ice Cream
5
10
7
1
Pizza
7
10
8
Ice Cream
Pizza
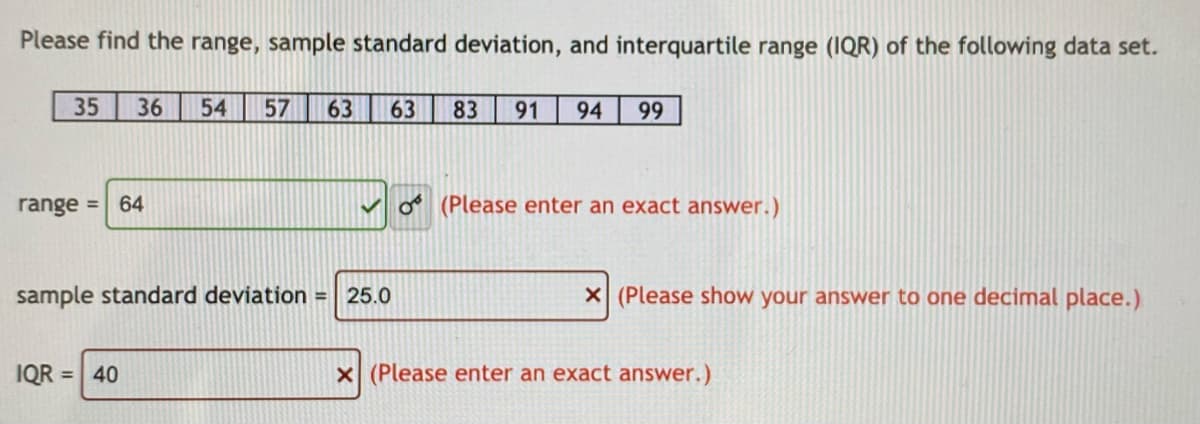
Transcribed Image Text:Please find the range, sample standard deviation, and interquartile range (IQR) of the following data set.
35 36
range = 64
54 57 63
IQR = 40
63
sample standard deviation = 25.0
83
91 94 99
(Please enter an exact answer.)
X (Please show your answer to one decimal place.)
x (Please enter an exact answer.)
Expert Solution
Step 1
Sketch the graph.

Trending now
This is a popular solution!

Step by step
Solved in 4 steps with 5 images

Recommended textbooks for you
Glencoe Algebra 1, Student Edition, 9780079039897…
Algebra
ISBN:
9780079039897
Author:
Carter
Publisher:
McGraw Hill

Algebra: Structure And Method, Book 1
Algebra
ISBN:
9780395977224
Author:
Richard G. Brown, Mary P. Dolciani, Robert H. Sorgenfrey, William L. Cole
Publisher:
McDougal Littell
Glencoe Algebra 1, Student Edition, 9780079039897…
Algebra
ISBN:
9780079039897
Author:
Carter
Publisher:
McGraw Hill
Algebra: Structure And Method, Book 1
Algebra
ISBN:
9780395977224
Author:
Richard G. Brown, Mary P. Dolciani, Robert H. Sorgenfrey, William L. Cole
Publisher:
McDougal Littell