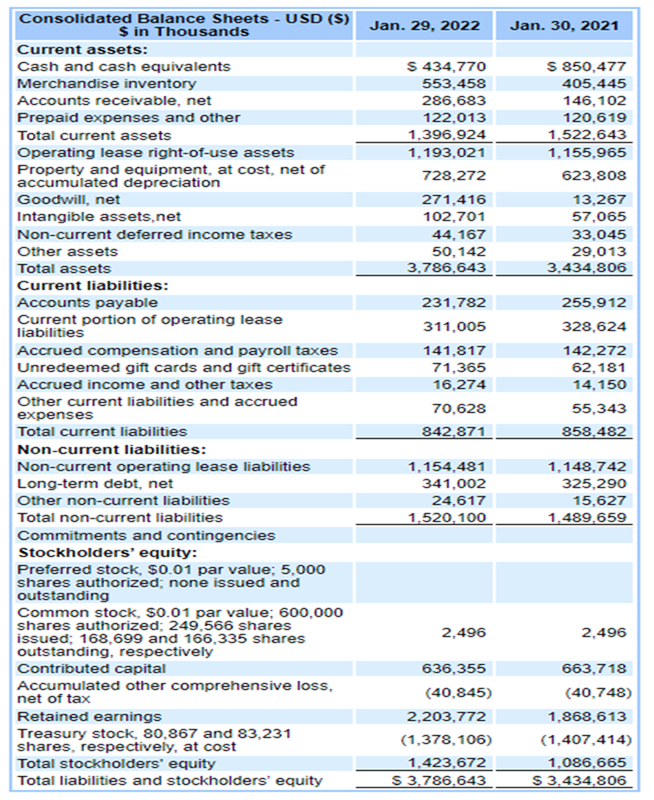
Compute 2 years of the following ratios from the financial statements below: A. Profit margin ratio B. Return on total assets C. Return on equity D. Basic earnings per share E. Current ratio F. Debt ratio Additional information: Total Assets as of Feb 1, 2020 ___________________$3,328,679 ($ in Thousands) Total Stockholders’ equity as of Feb 1, 2020 ________$1,247,853 ($ in Thousands
Compute 2 years of the following ratios from the financial statements below: A. Profit margin ratio B. Return on total assets C. Return on equity D. Basic earnings per share E. Current ratio F. Debt ratio Additional information: Total Assets as of Feb 1, 2020 ___________________$3,328,679 ($ in Thousands) Total Stockholders’ equity as of Feb 1, 2020 ________$1,247,853 ($ in Thousands

Intermediate Accounting: Reporting And Analysis
3rd Edition
ISBN:9781337788281
Author:James M. Wahlen, Jefferson P. Jones, Donald Pagach
Publisher:James M. Wahlen, Jefferson P. Jones, Donald Pagach
Chapter12: Intangibles
Section: Chapter Questions
Problem 9MC

Related questions
Question
Compute 2 years of the following ratios from the financial statements below:
A. Profit margin ratio
B. Return on total assets
C. Return on equity
D. Basic earnings per share
E.
F. Debt ratio
Additional information: Total Assets as of Feb 1, 2020 ___________________$3,328,679 ($ in Thousands) Total
Transcribed Image Text:Consolidated Balance Sheets - USD ($)
$ in Thousands
Current assets:
Cash and cash equivalents
Merchandise inventory
Accounts receivable, net
Prepaid expenses and other
Total current assets
Operating lease right-of-use assets
Property and equipment, at cost, net of
accumulated depreciation
Goodwill, net
Intangible assets, net
Non-current deferred income taxes
Other assets
Total assets
Current liabilities:
Accounts payable
Current portion of operating lease
liabilities
Accrued compensation and payroll taxes
Unredeemed gift cards and gift certificates
Accrued income and other taxes
Other current liabilities and accrued
expenses
Total current liabilities
Non-current liabilities:
Non-current operating lease liabilities
Long-term debt, net
Other non-current liabilities
Total non-current liabilities
Commitments and contingencies
Stockholders' equity:
Preferred stock, $0.01 par value; 5,000
shares authorized; none issued and
outstanding
Common stock, $0.01 par value; 600,000
shares authorized; 249,566 shares
issued; 168,699 and 166,335 shares
outstanding, respectively
Contributed capital
Accumulated other comprehensive loss,
net of tax
Retained earnings
Treasury stock, 80,867 and 83,231
shares, respectively, at cost
Total stockholders' equity
Total liabilities and stockholders' equity
Jan. 29, 2022
S 434,770
553,458
286,683
122,013
1,396,924
1,193,021
728,272
271,416
102,701
44,167
50,142
3,786,643
231,782
311,005
141,817
71,365
16,274
70,628
842,871
1,154,481
341,002
24,617
1,520,100
2,496
636,355
(40,845)
2,203,772
(1,378,106)
1,423,672
S 3,786,643
Jan. 30, 2021
S 850,477
405,445
146,102
120,619
1,522,643
1,155,965
623,808
13,267
57,065
33,045
29,013
3,434,806
255,912
328,624
142,272
62,181
14,150
55,343
858,482
1,148,742
325,290
15,627
1,489,659
2,496
663,718
(40,748)
1,868,613
(1,407,414)
1,086,665
$3,434,806
![Consolidated Statements of
Operations - USD ($)
shares in Thousands, $ in Thousands
Income Statement [Abstract]
Total net revenue
Cost of sales, including certain buying,
occupancy and warehousing expenses
Gross profit
Selling, general and administrative
expenses
Impairment, restructuring and COVID-19
related charges
Depreciation and amortization expense
Operating income (loss)
Interest expense (income), net
Other income, net
income (loss) before income taxes
Provision (benefit) for income taxes
Net income (loss)
Basic net income (loss) per common
sh
Diluted net income (loss) per common
share
Weighted average common shares
outstanding - basic
Weighted average common shares
outstanding-diluted
[1]
[1]
Jan. 29, 2022
$ 5,010,785
3,018,995
1,991,790
1,222,000
11,944
166,781
591,065
34,632
(2,489)
558,922
139,293
$ 419,629
$2.50
$ 2.03
168,156
206,529
12 Months Ended
Jan. 30, 2021
$ 3,759,113
2,610,966
1.148,147
977,264
279,826
162,402
(271.345)
24,610
(3,682)
(292,273)
(82,999)
S (209,274)
$ (1.26)
$ (1.26)
166,455
166,455](/v2/_next/image?url=https%3A%2F%2Fcontent.bartleby.com%2Fqna-images%2Fquestion%2Ffd708b04-3d99-4633-92b8-2f074cbf36a9%2F11a3d97f-82e8-4d0f-b6f1-ab3d0592a8e8%2Fmwe0kts_processed.png&w=3840&q=75)
Transcribed Image Text:Consolidated Statements of
Operations - USD ($)
shares in Thousands, $ in Thousands
Income Statement [Abstract]
Total net revenue
Cost of sales, including certain buying,
occupancy and warehousing expenses
Gross profit
Selling, general and administrative
expenses
Impairment, restructuring and COVID-19
related charges
Depreciation and amortization expense
Operating income (loss)
Interest expense (income), net
Other income, net
income (loss) before income taxes
Provision (benefit) for income taxes
Net income (loss)
Basic net income (loss) per common
sh
Diluted net income (loss) per common
share
Weighted average common shares
outstanding - basic
Weighted average common shares
outstanding-diluted
[1]
[1]
Jan. 29, 2022
$ 5,010,785
3,018,995
1,991,790
1,222,000
11,944
166,781
591,065
34,632
(2,489)
558,922
139,293
$ 419,629
$2.50
$ 2.03
168,156
206,529
12 Months Ended
Jan. 30, 2021
$ 3,759,113
2,610,966
1.148,147
977,264
279,826
162,402
(271.345)
24,610
(3,682)
(292,273)
(82,999)
S (209,274)
$ (1.26)
$ (1.26)
166,455
166,455
Expert Solution
This question has been solved!
Explore an expertly crafted, step-by-step solution for a thorough understanding of key concepts.

This is a popular solution!

Trending now
This is a popular solution!

Step by step
Solved in 2 steps with 1 images

Knowledge Booster


Learn more about
Need a deep-dive on the concept behind this application? Look no further. Learn more about this topic, accounting and related others by exploring similar questions and additional content below.Recommended textbooks for you
Intermediate Accounting: Reporting And Analysis
Accounting
ISBN:
9781337788281
Author:
James M. Wahlen, Jefferson P. Jones, Donald Pagach
Publisher:
Cengage Learning

Financial Accounting: The Impact on Decision Make…
Accounting
ISBN:
9781305654174
Author:
Gary A. Porter, Curtis L. Norton
Publisher:
Cengage Learning

Financial And Managerial Accounting
Accounting
ISBN:
9781337902663
Author:
WARREN, Carl S.
Publisher:
Cengage Learning,
Intermediate Accounting: Reporting And Analysis
Accounting
ISBN:
9781337788281
Author:
James M. Wahlen, Jefferson P. Jones, Donald Pagach
Publisher:
Cengage Learning
Financial Accounting: The Impact on Decision Make…
Accounting
ISBN:
9781305654174
Author:
Gary A. Porter, Curtis L. Norton
Publisher:
Cengage Learning
Financial And Managerial Accounting
Accounting
ISBN:
9781337902663
Author:
WARREN, Carl S.
Publisher:
Cengage Learning,