Compute for the mean and median of the sample data. E. What is the range of the loaf bread weight? F. Calculate the variance of the sample weight.


Q: A physical therapist wants to determine the difference in the proportion of men and women who…
A: From the provided information, Margin of error (E) = 3% that is 0.03 Confidence level = 95% And
Q: The following scores were given by 6 judges for a gymnast's performance in vault of an international…
A:
Q: Listed below are the top 10 salaries (in millions of dollars) of TV personalities.Find the…
A: (i)Range=Maximum value-Minimum value=40-13=27
Q: Calculate the sample variance of the following score? 5,5,5,5,5
A:
Q: Calculate the Sample Variance for the following data set: 4, 5, 3, 0.
A: Given data, 4, 5, 3, 0.
Q: 2. The data below shows six sample data that was gathered from a periodical exam of Grade 10 section…
A:
Q: the probability for the number of sales calls completed per day by a number of sales people is given…
A: Given X 0 1 2 3 4 Px 116 416 616 416 116
Q: The following set of data is from a sample of n=6. 6 59 6 3 13 O a. Compute the mean, median, and…
A: Since you have posted a question with multiple sub-parts, we will solve first three sub-parts for…
Q: et the sample mean, sample variance, and sample standard deviation: X P(x) x *P(x)…
A: Form the provided data we have, xi fi fixi fixi^2 57 1 57 3249 59 3 177…
Q: 2- The sample mean and sample Variance of the following data are X 7 9. 14
A: Note: Hey, since there are multiple questions posted, as per guidelines we will answer first…
Q: Find the variance of the following sample data: 11, 13, 14, 15 and 21 (Write the answer up to 1…
A: Given that 11,13,14,15,21 To find the variance
Q: Listed below are the top 10 annual salaries (in millions of dollars) of TV personalities. Find…
A: Given: 38, 37, 35, 27, 18, 16, 15, 14, 13.9, 13.3 Minimum = 13.3 and Maximum = 38
Q: 30. The following scores were given by 6judges for a gymnasts performance in vault of an…
A:
Q: A USA Today poll asked a random sample of 1012 U.S. adults what they do with the milk in the bowl…
A: From the provided information, Sample size (n) = 1012 A spokesman for the dairy industry claims that…
Q: The following set of data is from a sample of n=7. 5 4 12 11 10 4 3 a.…
A: The mean of a data set is calculated by dividing the sum of observations with the number of…
Q: Consider the two following sample data sets. Notice that each observation in Data Set 2 is 10 more…
A:
Q: Here are 6 celebrities with some of the highest net worths (in millions of dollars) in a recent…
A: In a set of data, a range is defined as the difference between the highest value in the data set and…
Q: Suppose that 29% of undergraduates at a large university are involved in a campus organization. The…
A: We have given that the Binomial distribution with parameters n=100 and p=0.29 , q=0.71. Formulae in…
Q: B. Read and answer the following questions independently. Show your solution if necessary. 1. If the…
A: Note: " Since you have posted many sub-parts. we will solve the first three sub-parts for you. To…
Q: The following data give the numbers of pieces of junk mail received by 10 office secretaries during…
A: Given: data n =10 To find : i) range ii) variance iii) standard deviation
Q: If the sample standard deviation for the number of members at each of 25 fitness clubs is 41, what…
A: Given that If the sample standard deviation for the number of members at each of 25 fitness clubs…
Q: 2. Given the mean age of 15 children in the table below is 3.4, determine the sample variance and…
A: The mean age of 15 children are given , we have to find the sample variance and the standard…
Q: Find the sample variance of the following set of data: 8, 7, 11, 10, 10, 8.
A: Given data, 8, 7, 11, 10, 10, 8. Sample variance=?
Q: In your two sets of Statistics tests, find the mean of the number of tests that will be passed. 1.…
A: Given: The provided dataset is given as: Number of passed test (x) Probability P(x) 0 0.25 1…
Q: The following set of data is from a sample of n=6. 6 10 2 6 7 13 a. Compute the mean, median,…
A: Heh there! Thanks for posting the question. Your question has more than three sub-parts. However, we…
Q: The asking prices (in thousands of dollars) for a sample of 13 houses currently on the market in…
A: It is given that the price of homes the following month all increase by 25%. The mean is affected by…
Q: The table below shows the age distribution of a sample of 150 students at UCC. Find an estimate of…
A: Data given Let X=Age , Number =f Age Number 25 - 34 33 35 - 44 39 45 - 54 48 55 - 64 30
Q: The following data show the number of hours spent watching television for 10 randomly selected…
A: Range: For a set of observations, range is defined as the difference between the maximum and the…
Q: A semiconductor manufacturer produces devices used as central processing units in personal…
A: The following data is given:…
Q: The following is a set of data from a sample of n=5. 3 4 8 1 5 a. Compute the…
A: a. Mean: Mean is the expected value of a set of observations. In other words, mean is the average of…
Q: Listed below are the top 10 annual salaries (in millions of dollars) of TV personalities. Find…
A: We have given that, 39, 37, 35, 27, 15, 11, 9, 7, 6.8, 6.3 Then, We will find variance, standard…
Q: A major airport recently hired consultant John Cadariu to study the problem of air traffic delays.…
A: Solution: Minutes late Number of flights(f) Midpoint (x) x2 fx fx2 0-10 30 5 25 150 750 20-…
Q: Consider a sample of 100 insurance policies from a portfolio of a general insurance company. The…
A: It is been asked to find the sample variance using the given information.
Q: Listed below are the top 10 annual salaries (in millions of dollars) of TV personalities. Find…
A: Range: From the given observations, the maximum value is 38 and the minimum value is 10.7.…
Q: Below is a data set of n = 16 that expresses the overall miles per gallon (MPG) of family sedans:…
A:
Q: What is the difference between Micro and M? a. Micro (u) is the variance and M is the mean b.…
A: We know that symbol (u) represents the population mean
Q: Listed below are the top 10 annual salaries (in millions of dollars) of TV personalities. Find the…
A: The following data has been given: 42 41 39 31 20 19 16 12 11.7 10.6
Q: Listed below are the top 10 annual salaries (in millions of dollars) of TV personalities. Find the…
A: From given data: a) Range of the sample data Range=Highest Value-Lowest Value=38-8.8=29.2 The…
Q: get the sample mean, sample variance, and sample standard deviation: X P(x) x *P(x)…
A: Given Information: X P(X) X.PX X2 X2.PX 57 122 2.5935 3249 147.8295 59 322 8.0476 3481…
Q: A recent survey of students at Regina Mundi College included a question about the number of school…
A:
Q: Listed below are the top 10 annual salaries (in millions of dollars) of TV personalities. Find…
A:
Q: 1.3. Find the estimated standard error of the proportion if, in the sample of machines, 36 machines…
A: Given that a paper company has about 50 paper mills, which have a total of 600 machines. From…
Q: Listed below are the top 10 annual salaries (in millions of dollars) of TV personalities. Find the…
A:
Q: Compute each of the single-variable statistics discussed in class for the data below: 84.7 58.2…
A: Arrange the given data in ascending order44.3, 58.2, 58.2, 68.3, 84.1, 84.7, 89.1, 89.7, 91.9,…
Q: Compute for the mean and the standard deviation of the sampling distribution of the sample mean…
A:
Q: Listed below are the top 10 annual salaries (in millions ofdollars) of TV personalities. Find the…
A: Obtain the value of range. The value of Range is obtained below: The formula to obtain the range is,…
Q: Listed below are the top 10 annual salaries (in millions of dollars) of TV personalities. Find the…
A:
Q: Suppose that in a truckload of potatoes, 6% of the potatoes are bruised or damaged in some way. What…
A: Given: p=0.06 n=200 The mean of sampling distribution of the sample proportion is approximately…
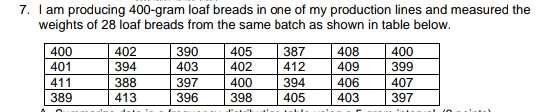
7. I am producing 400-gram loaf breads in one of my production lines and measured the
weights of 28 loaf breads from the same batch as shown in table below. (*see attached image for the table.)
D. Compute for the mean and median of the sample data.
E. What is the range of the loaf bread weight?
F. Calculate the variance of the sample weight.

Step by step
Solved in 3 steps with 2 images

- Between 1971 and 1975, as part of the National Health and Nutrition Examination Survey (NHANES), 7,381 persons ages 40–77 years were enrolled in a follow-up study. At the time of enrollment, each study participant was classified as having or not having diabetes. During 1982–1984, enrollees were documented either to have died or were still alive. The results are summarized as follows. 1. Of the men enrolled in the NHANES follow-up study, calculate the ratio of non-diabetic to diabetic men. 2. Calculate the proportion of men in the NHANES follow-up study who were diabetics. 3. Calculate the proportion of deaths among men.A company studied the number of lost-time accidents occurring at its Brownsville, Texas, plant. Historical records show that 6% of the employees suffered lost-time accidents last year. Management believes that a special safety program will reduce such accidents to 5% during the current year. In addition, it estimates that 15% of employees who had lost-timeaccidents last year will experience a lost-time accident during the current year. a. What percentage of the employees will experience lost-time accidents in both years?b. What percentage of the employees will suffer at least one lost-time accident over the two-year period?Consider a case where 400 fish are tagged and released during a first outing. During a second outing in the same area, 400 fish are again caught and released, of which half are already tagged. Estimate N, the total number of fish in the entire sampling area.
- Suppose that in 2008, 628,250 citizens died of a certain disease. Assuming the population of the country is 211 million, what was the morality rate in units of deaths per 100,000 people ?29-What percentage of students are enrolled in between 12 and 18 credits?a) What proportion of 20% of defective items should a supervisor in the quality system of a plastic products company accept when they ask him to evaluate a routine inspection procedure for orders of 100 identical articles, knowing that the procedure consists of taking a sample of 10 items and the one to accept the order if no more than 2 defective items are found? b) How many defective items are expected to appear in the sample?
- Is the number of games won by a major league baseball team in a season related to the team batting average? The table below shows the number of games won and the batting average (in thousandths) of 8 teams. Team Games Won Batting Average 1 8383 289289 2 116116 290290 3 101101 287287 4 8181 262262 5 110110 288288 6 119119 269269 7 6060 268268 8 6161 280280 Using games won as the explanatory variable xx, do the following: (a) The correlation coefficient is r=r= . (b) The equation of the least squares line is y^=y^=The table below is a measure of how many ounces of caffeinated coffee a person drinks and how much sleep they get. Ounces of coffee Hours of sleep.22 8.924 6.338 5.922 6.819 7.435 6.428 7.219 7.627 8.928 9.325 5.418 6.135 4.333 8.128 5.817 6.325 4.832 5.418 7.522 6.825 4.735 6.541 4.218 7.351 6.818 5.932 8.127 4.138 5.841 6.452 7.718 9.434 4.541 3.533 6.837 9.228 6.151 9.217 6.318 4.525 6A) Give the Pearson coefficient. B) Now that you found the answer to A, do you expect there to be a strong correlation?Is the number of games won by a major league baseball team in a season related to the team batting average? The table below shows the number of games won and the batting average (in thousandths) of 8 teams. Team Games Won Batting Average 1 9797 269269 2 9595 275275 3 8686 273273 4 9999 261261 5 6464 285285 6 118118 260260 7 8787 274274 8 8888 280280 Using games won as the explanatory variable ?x, compute the correlation coefficient
- A new machine is set or calibrated to fill tubes of toothpaste at precisely 6.75 ounces. Then, once the machine is running, a sample of six tubes is taken every three hours and weighed with the following results: WEIGHT OF TOOTHPASTE Time 7 am 6.69 6.68 6.79 6.77 6.74 6.76 10 am 6.71 6.72 6.71 6.76 6.75 6.74 1 pm 6.66 6.68 6.67 6.71 6.76 6.78 4 pm 6.73 6.74 6.72 6.76 6.78 6.75 7 pm 6.75 6.73 6.75 6.77 6.79 6.75 The measurement of quality is based on _______. A. a scale B. an attribute C. a chart D. a variableThe following data has been collected on the interarrival times of patients to an emergency department: 3.772, 1.761, 0.743, 15.988, 0.412, 7.541, 6.900, 3.447, 7.024, 1.061, 5.449, 0.309, 0.766, 4.807, 8.143, 0.093, 9.524, 0.012, 4.634, and 0.195 minutes. Estimate the squared coefficient of variation of the arrival process. Is the arrival process likely to be Poisson? Why or why not? Estimate the arrival rate?A Farm grows normally distributed potatoes and is testing a new crop. After 4 months, 20 plants produce potatoes with the following weights (in kg):7, 1.4, 1.4, 1.3, 0.3, 1.4, 0.6, 1.3, 1.3, 1.1, 0.9, 1.5, 1.1, 1.5, 0.6, 1.4, 1.1, 0.5, 0.6, 0.8 b) What percent of potatoes grown from this crop will be over 2 kg? Mean: 1.1 Standard deviation: 0.3883
