compute the following ratios using the Balance Sheet (Current Year) and Income Statement provided in the images below Current Ratio (in numeric format, 2 decimal places): Debt to Equity (in numeric format, 2 decimal places(): Return on Equity (stated as a percentage, 2 decimal places):
compute the following ratios using the Balance Sheet (Current Year) and Income Statement provided in the images below Current Ratio (in numeric format, 2 decimal places): Debt to Equity (in numeric format, 2 decimal places(): Return on Equity (stated as a percentage, 2 decimal places):

Fundamentals Of Financial Management, Concise Edition (mindtap Course List)
10th Edition
ISBN:9781337902571
Author:Eugene F. Brigham, Joel F. Houston
Publisher:Eugene F. Brigham, Joel F. Houston
Chapter10: The Cost Of Capital
Section: Chapter Questions
Problem 1TCL: CALCULATING 3MS COST OF CAPITAL Use online resources to work on this chapters questions. Please note...

Related questions
Question
compute the following ratios using the Balance Sheet (Current Year) and Income Statement provided in the images below
Current Ratio (in numeric format, 2 decimal places):
Debt to Equity (in numeric format, 2 decimal places():
Transcribed Image Text:M Celebrate Black x
Quiz: Midterm x
y! Describe the m x
The simple diff x
y! bartleby - Yaho x
b My Questions X
O Balance Sheet. X
+
O File | C:/Users/errab/Downloads/Balance%20Sheet.pdf
a
Balance Sheet.pdf
1 / 1
67%
+
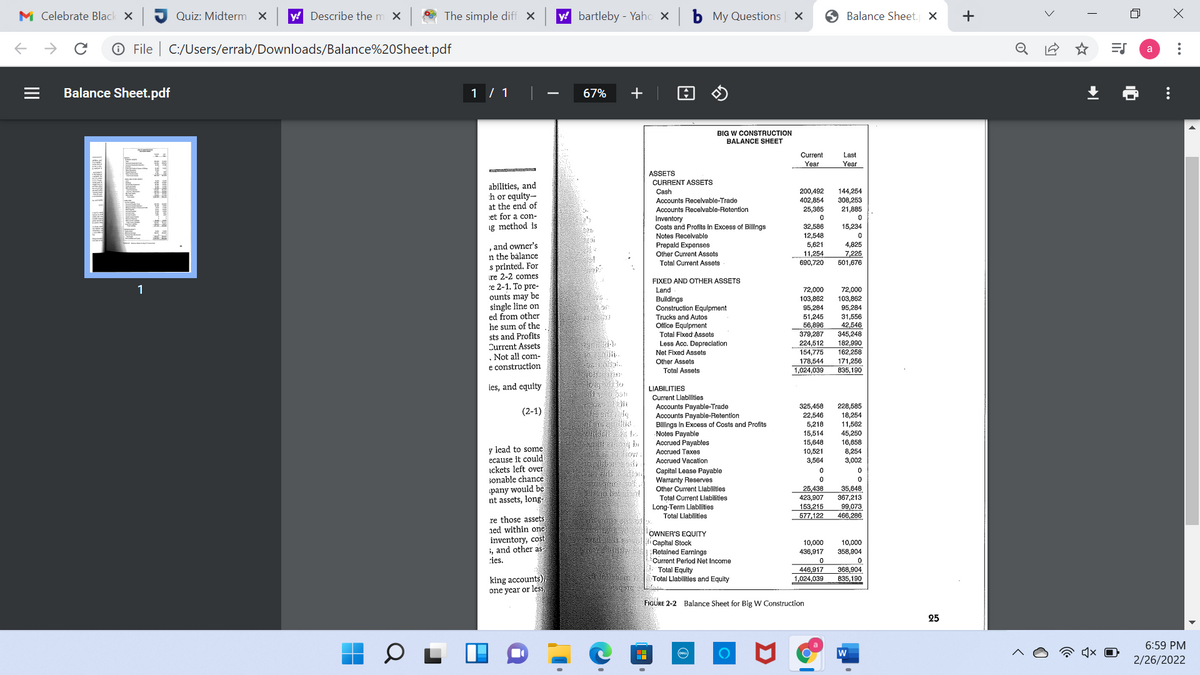
BIG W CONSTRUCTION
BALANCE SHEET
Current
Last
Year
Year
ASSETS
CURRENT ASSETS
abilities, and
h or equity-
at the end of
et for a con-
ig method is
200.492
144,254
308.253
Cash
Accounts Receivable-Trade
402,854
25,365
Accounts Recelvable-Retention
Inventory
Costs and Profits in Excess
Notes Receivablo
Prepaid Expenses
21,885
Billings
32,586
15,234
12,548
, and owner's
n the bálance
s printed. For
re 2-2 comes
е 2-1. То pre-
ounts may be
single line on
ed from other
5,621
11,254
690,720
4,825
7,225
501,676
Other Current Assets
Total Current Assets
FIXED AND OTHER ASSETS
Land
Buildings
Construction Equipment
1
72,000
103,862
95,284
51,245
56,896
379,287
224,512
154,775
72,00
103,862
95,284
31,556
42,546
345,248
182,990
Trucks and Autos
he sum of the
and Profits
Current Assets
Not all com-
Office Equipment
Total Fixed Assets
Less Acc. Depreclation
Net Fixed Assets
sts
162,258
171,256
835,190
Other Assets
e construction
178,544
1,024,039
Total Assets
les, and equity
LIABILITIES
Current Llabilities
228,585
Accounts Payable-Trade
Accounts Payable-Retention
Billings In Excess of Costs and Profits
Notes Payable
325,458
(2-1)
22,546
5,218
15,514
15,648
10,521
3,564
18,254
11,562
45,250
16,658
8,254
3,002
Accrued Payables
Accrued Taxes
y lead to some
ecause it could
ickets left over
sonable chance
pany would be
nt assets, long-
Accrued Vacation
Capital Lease Payable
Warranty Reserves
Other Current Llabilities
25,438
423,907
35,648
367,213
99,073
466,286
Total Current Liabilities
153,215
577,122
Long-Term Liablities
Total Liabilities
re those assets
1ed within one
inventory, cost
i, and other as
:ies.
OWNER'S EQUITY
Capltal Stock
Retained Earnings
Current Perlod Net Income
Total Equity
Total Llablities and Equity
10,000
436,917
10,000
358,904
446,917
368,904
king accounts),
one year or less
1,024,039
835,190
FIGURE 2-2 Balance Sheet for Big W Construction
25
6:59 PM
2/26/2022
..
of
| Wg 川
ii.
II
Transcribed Image Text:M Celebrate B X
y! Describe th X
Quiz: Midte x
The simple X
y! bartleby - Y × b My Questio X
O Balance She X
S Income Stat X
O File | C:/Users/errab/Downloads/Income%20Statement%20(1).pdf
a
Income Statement (1).pdf
1 / 1
67%
+
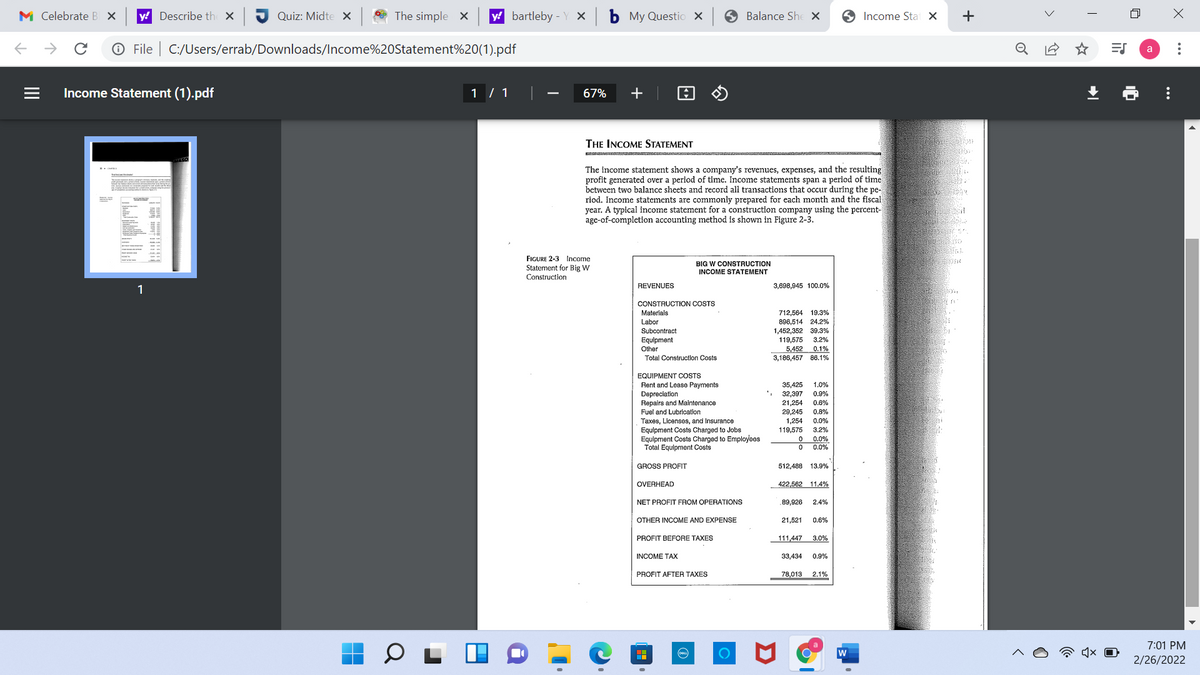
THE INCOME STATEMENT
The income statement shows a company's revenues, expenses, and the resulting
profit generated over a period of time. Income statements span a period of time
between two balance sheets and record all transactions that occur during the pe-
riod. Income statements are commonly prepared for each month and the fiscal
year. A typical income statement for a construction company using the percent-
age-of-completion accounting method is shown in Figure 2-3.
FIGURE 2-3 Income
Statement for Big W
Construction
BIG W CONSTRUCTION
INCOME STATEMENT
1
REVENUES
3,698,945 100.0%
CONSTRUCTION COSTS
Materials
712,564
19.3%
896,514 24.2%
1,452,352 39.3%
119,575
Labor
Subcontract
Equipment
3.2%
Other
5,452
0.1%
Total Construction Costs
3,186,457 86.1%
EQUIPMENT COSTS
Rent and Loase Payments
Depreciation
Repairs and Malntenance
Fuel and Lubrication
Taxes, Licenses, and Insurance
Equipment Costs Charged to Jobs
Equlpment Costs Charged to Employoos
Total Equipment Costs
35,425
32,397
21,254
29,245
1,254
119,575
1.0%
0.9%
0.6%
0.8%
0.0%
3.2%
0.0%
0.0%
GROSS PROFIT
512,488 13.9%
OVERHEAD
422,562 11.4%
NET PROFIT FROM OPERATIONS
89,926
2.4%
OTHER INCOME AND EXPENSE
21,521
0.6%
PROFIT BEFORE TAXES
111,447
3.0%
INCOME TAX
33,434
0.9%
PROFIT AFTER TAXES
78,013
2.1%
7:01 PM
2/26/2022
..
of
+
II
Expert Solution
Step 1
Hi student
Since there are multiple subparts, we will answer only first three subparts.

Trending now
This is a popular solution!

Step by step
Solved in 2 steps

Knowledge Booster


Learn more about
Need a deep-dive on the concept behind this application? Look no further. Learn more about this topic, finance and related others by exploring similar questions and additional content below.Recommended textbooks for you
Fundamentals Of Financial Management, Concise Edi…
Finance
ISBN:
9781337902571
Author:
Eugene F. Brigham, Joel F. Houston
Publisher:
Cengage Learning

Fundamentals of Financial Management (MindTap Cou…
Finance
ISBN:
9781285867977
Author:
Eugene F. Brigham, Joel F. Houston
Publisher:
Cengage Learning

Fundamentals Of Financial Management, Concise Edi…
Finance
ISBN:
9781337902571
Author:
Eugene F. Brigham, Joel F. Houston
Publisher:
Cengage Learning
Fundamentals of Financial Management (MindTap Cou…
Finance
ISBN:
9781285867977
Author:
Eugene F. Brigham, Joel F. Houston
Publisher:
Cengage Learning

Survey of Accounting (Accounting I)
Accounting
ISBN:
9781305961883
Author:
Carl Warren
Publisher:
Cengage Learning

Fundamentals of Financial Management, Concise Edi…
Finance
ISBN:
9781285065137
Author:
Eugene F. Brigham, Joel F. Houston
Publisher:
Cengage Learning