Compute the mean precipitation for the catchment shown by Arithmetic Mean Method.
Compute the mean precipitation for the catchment shown by Arithmetic Mean Method.

Chapter2: Loads On Structures
Section: Chapter Questions
Problem 1P

Related questions
Question
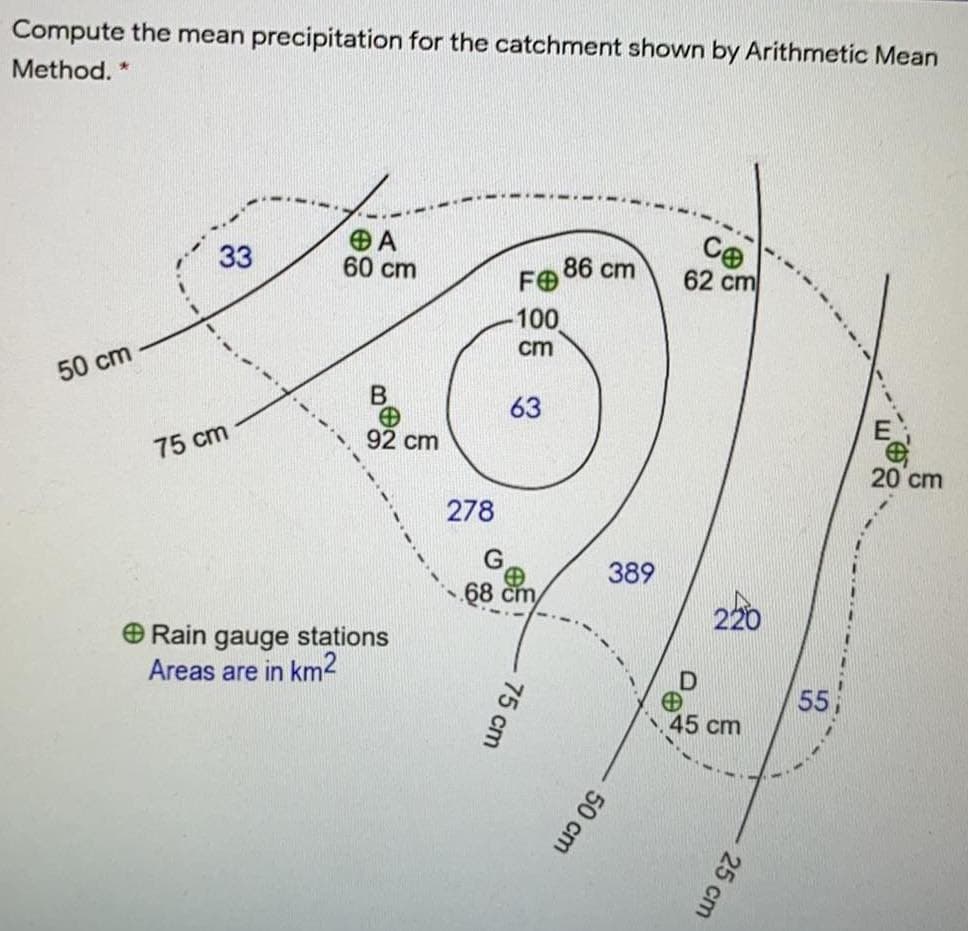
Transcribed Image Text:Compute the mean precipitation for the catchment shown by Arithmetic Mean
Method. *
A
60 cm
Ce
62 cm
33
86 cm
FO
100
cm
50 cm
63
92 cm
75 cm
20 cm
278
389
68 cm
220
O Rain gauge stations
Areas are in km2
55i
45 cm
25 cm
50 cm
75 cm
Expert Solution
This question has been solved!
Explore an expertly crafted, step-by-step solution for a thorough understanding of key concepts.

Step by step
Solved in 2 steps

Recommended textbooks for you

Structural Analysis (10th Edition)
Civil Engineering
ISBN:
9780134610672
Author:
Russell C. Hibbeler
Publisher:
PEARSON

Principles of Foundation Engineering (MindTap Cou…
Civil Engineering
ISBN:
9781337705028
Author:
Braja M. Das, Nagaratnam Sivakugan
Publisher:
Cengage Learning
Structural Analysis (10th Edition)
Civil Engineering
ISBN:
9780134610672
Author:
Russell C. Hibbeler
Publisher:
PEARSON
Principles of Foundation Engineering (MindTap Cou…
Civil Engineering
ISBN:
9781337705028
Author:
Braja M. Das, Nagaratnam Sivakugan
Publisher:
Cengage Learning

Fundamentals of Structural Analysis
Civil Engineering
ISBN:
9780073398006
Author:
Kenneth M. Leet Emeritus, Chia-Ming Uang, Joel Lanning
Publisher:
McGraw-Hill Education


Traffic and Highway Engineering
Civil Engineering
ISBN:
9781305156241
Author:
Garber, Nicholas J.
Publisher:
Cengage Learning