
Biology (MindTap Course List)
11th Edition
ISBN:9781337392938
Author:Eldra Solomon, Charles Martin, Diana W. Martin, Linda R. Berg
Publisher:Eldra Solomon, Charles Martin, Diana W. Martin, Linda R. Berg
Chapter1: A View Of Life
Section: Chapter Questions
Problem 7TYU: Ideally, an experimental group differs from a control group (a) only with respect to the hypothesis...

Related questions
Question
Use the computed values for reference
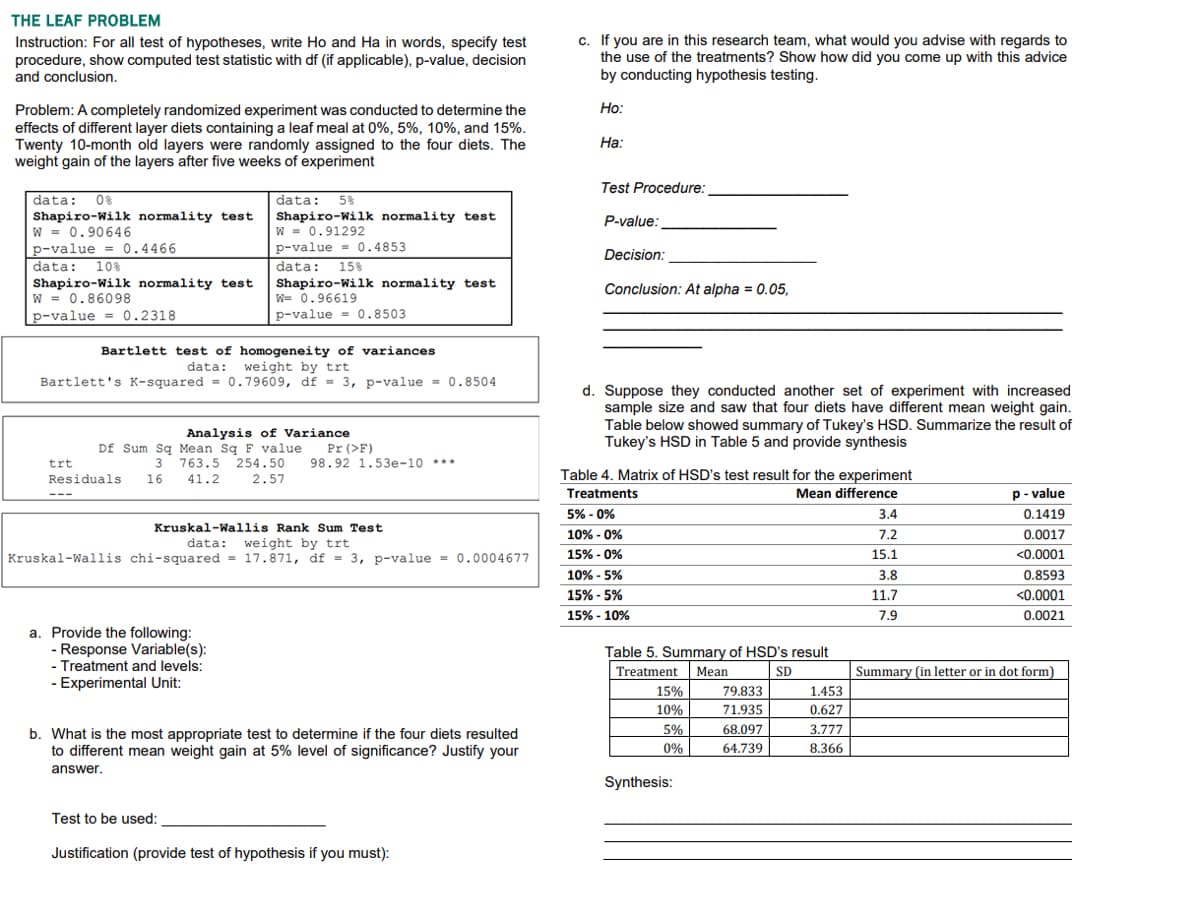
Transcribed Image Text:THE LEAF PROBLEM
Instruction: For all test of hypotheses, write Ho and Ha in words, specify test
procedure, show computed test statistic with df (if applicable), p-value, decision
and conclusion.
c. If you are in this research team, what would you advise with regards to
the use of the treatments? Show how did you come up with this advice
by conducting hypothesis testing.
Но:
Problem: A completely randomized experiment was conducted to determine the
effects of different layer diets containing a leaf meal at 0%, 5%, 10%, and 15%.
Twenty 10-month old layers were randomly assigned to the four diets. The
weight gain of the layers after five weeks of experiment
На:
Test Procedure:
data:
0%
data:
58
Shapiro-Wilk normality test
w = 0.90646
Shapiro-Wilk normality test
w = 0.91292
P-value:
p-value = 0.4466
|data:
Shapiro-Wilk normality test
w = 0.86098
p-value = 0.4853
Decision:
10%
data:
15%
Shapiro-Wilk normality test
W= 0.96619
Conclusion: At alpha = 0.05,
p-value = 0.2318
p-value = 0.8503
Bartlett test of homogeneity of variances
weight by trt
Bartlett's K-squared = 0.79609, df = 3, p-value = 0.8504
data:
d. Suppose they conducted another set of experiment with increased
sample size and saw that four diets have different mean weight gain.
Table below showed summary of Tukey's HSD. Summarize the result of
Tukey's HSD in Table 5 and provide synthesis
Analysis of Variance
Df Sum Sq Mean Sq F value
763.5 254.
Pr (>F)
98.92 1.53e-10 ***
trt
3
Residuals
16
41.2
2.57
Table 4. Matrix of HSD's test result for the experiment
Treatments
Mean difference
p- value
---
5% - 0%
3.4
0.1419
Kruskal-Wallis Rank Sum Test
10% - 0%
15% - 0%
7.2
0.0017
weight by trt
Kruskal-Wallis chi-squared = 17.871, df = 3, p-value = 0.0004677
data:
15.1
<0.0001
10% - 5%
3.8
0.8593
15% - 5%
11.7
<0.0001
15% - 10%
7.9
0.0021
a. Provide the following:
- Response Variable(s):
- Treatment and levels:
Table 5. Summary of HSD's result
| SD
Treatment
Mean
Summary (in letter or in dot form)
- Experimental Unit:
15%
79.833
1.453
10%
71.935
0.627
5%
68.097
3.777
b. What is the most appropriate test to determine if the four diets resulted
to different mean weight gain at 5% level of significance? Justify your
0%
64.739
8.366
answer.
Synthesis:
Test to be used:
Justification (provide test of hypothesis if you must):
Expert Solution
This question has been solved!
Explore an expertly crafted, step-by-step solution for a thorough understanding of key concepts.

This is a popular solution!

Trending now
This is a popular solution!

Step by step
Solved in 5 steps with 7 images

Knowledge Booster


Learn more about
Need a deep-dive on the concept behind this application? Look no further. Learn more about this topic, biology and related others by exploring similar questions and additional content below.Recommended textbooks for you
Biology (MindTap Course List)
Biology
ISBN:
9781337392938
Author:
Eldra Solomon, Charles Martin, Diana W. Martin, Linda R. Berg
Publisher:
Cengage Learning

Human Biology (MindTap Course List)
Biology
ISBN:
9781305112100
Author:
Cecie Starr, Beverly McMillan
Publisher:
Cengage Learning
Biology (MindTap Course List)
Biology
ISBN:
9781337392938
Author:
Eldra Solomon, Charles Martin, Diana W. Martin, Linda R. Berg
Publisher:
Cengage Learning
Human Biology (MindTap Course List)
Biology
ISBN:
9781305112100
Author:
Cecie Starr, Beverly McMillan
Publisher:
Cengage Learning