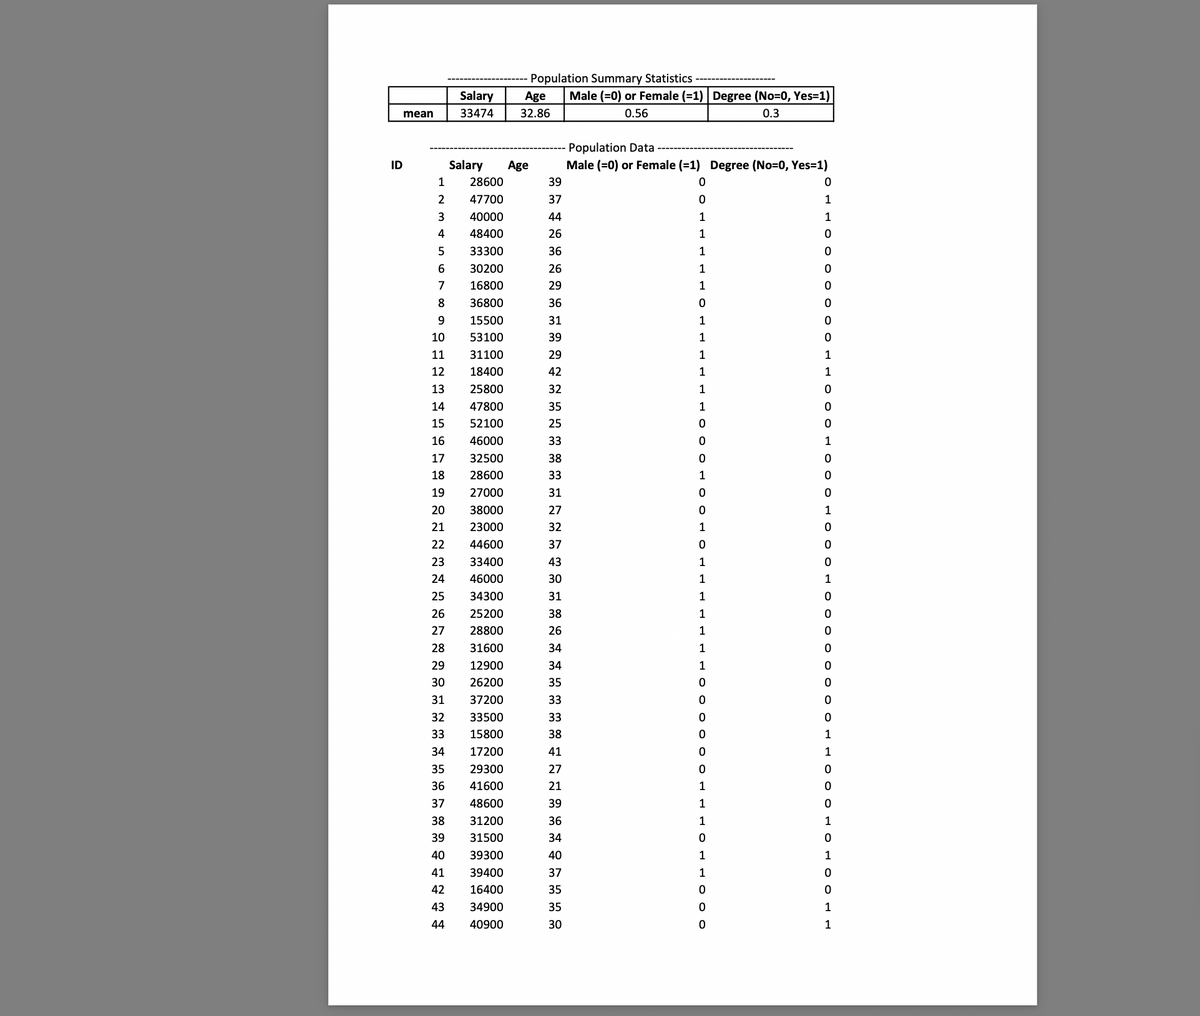
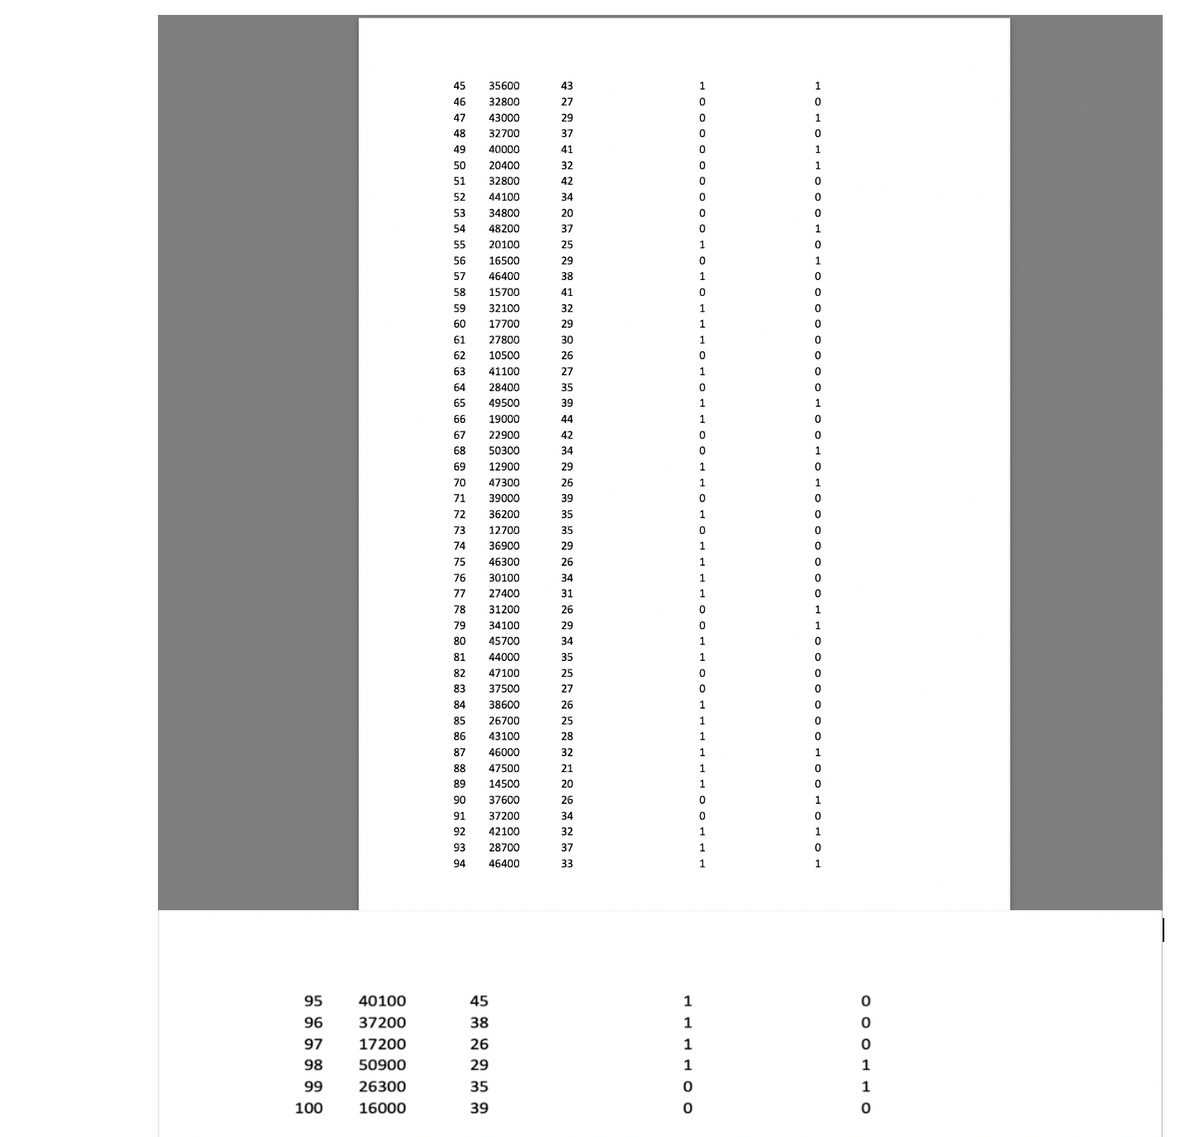
Consider a company which has a total population of 100 employees. The company recently conducted a census and measured the annual salary of its population (alongside other characteristics about the employees). You have been provided with an excel file and a pdf that contain this data. These 100 individuals comprise the population in our analysis. a) From the dataset select at random 5 different samples of 10 individuals. For each sample, randomly select 10 individuals from the company. After you have finished randomly selecting the 10 individuals for your first sample, record their information and then put them back in the population before starting the selection process for your next sample. Please do this 5 times, recording the ID number and income for each selection of each sample. Show your selections for all 5 samples. b) Carefully explain the process you use in selecting these samples. How does your procedure ensure that the samples are randomly selected? c) Compute the sample mean for all 5 samples. Note that the sample mean can be obtained using the 1? formula ? = ? ∑?=1 ?? (where n is the number of observations in the sample). d) Suppose the sample contains individuals with ID’s {7,17,29,35,37,59,73,77,89,96}. For this sample: Calculate the mean Salary, the mean Age, the fraction who are female, and the fraction who have a Degree. Compare these to the summary statistics of the population and comment


Consider a company which has a total population of 100 employees. The company recently conducted a census and measured the annual salary of its population (alongside other characteristics about the employees). You have been provided with an excel file and a
-
a) From the dataset select at random 5 different samples of 10 individuals. For each sample, randomly select 10 individuals from the company. After you have finished randomly selecting the 10 individuals for your first sample, record their information and then put them back in the population before starting the selection process for your next sample. Please do this 5 times, recording the ID number and income for each selection of each sample. Show your selections for all 5 samples.
-
b) Carefully explain the process you use in selecting these samples. How does your procedure ensure that the samples are randomly selected?
-
c) Compute the sample
mean for all 5 samples. Note that the sample mean can be obtained using the1?
formula ? = ? ∑?=1 ?? (where n is the number of observations in the sample). -
d) Suppose the sample contains individuals with ID’s {7,17,29,35,37,59,73,77,89,96}. For this sample: Calculate the mean Salary, the mean Age, the fraction who are female, and the fraction who have a Degree. Compare these to the summary statistics of the population and comment

Step by step
Solved in 5 steps

