Consider the following function. f(x) = V(x - 3)2 (a) Make a sign diagram for the first derivative. V ---Select-- ---Select--- ---Select--- f (x) >0 f'(x) < 0 X = f '(x) = 0 undefined (b) make a siyn uiagram for the second derivative. ---Select-- O ---Select-- e ---Select--- E X = (c) Sketch the graph, showing all relative extreme points and inflec
Consider the following function. f(x) = V(x - 3)2 (a) Make a sign diagram for the first derivative. V ---Select-- ---Select--- ---Select--- f (x) >0 f'(x) < 0 X = f '(x) = 0 undefined (b) make a siyn uiagram for the second derivative. ---Select-- O ---Select-- e ---Select--- E X = (c) Sketch the graph, showing all relative extreme points and inflec

Trigonometry (MindTap Course List)
10th Edition
ISBN:9781337278461
Author:Ron Larson
Publisher:Ron Larson
ChapterP: Prerequisites
SectionP.6: Analyzing Graphs Of Functions
Problem 6ECP: Find the average rates of change of f(x)=x2+2x (a) from x1=3 to x2=2 and (b) from x1=2 to x2=0.

Related questions
Question
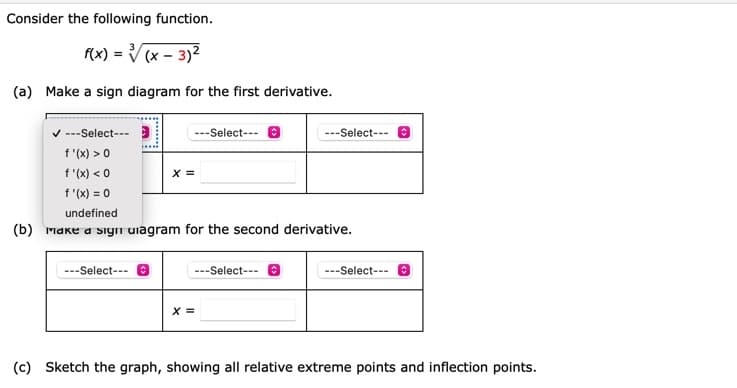
Transcribed Image Text:Consider the following function.
f(x) = V (x – 3)2
(a) Make a sign diagram for the first derivative.
V ---Select---
---Select---
---Select---
f '(x) > 0
f '(x) < 0
f (x) = 0
X =
undefined
(b)
Iake a sigi uagram for the second derivative.
--Select-- e
---Select--- 0
---Select--- e
X =
(c) Sketch the graph, showing all relative extreme points and inflection points.
Expert Solution
This question has been solved!
Explore an expertly crafted, step-by-step solution for a thorough understanding of key concepts.

This is a popular solution!

Trending now
This is a popular solution!

Step by step
Solved in 2 steps with 2 images

Recommended textbooks for you
Trigonometry (MindTap Course List)
Trigonometry
ISBN:
9781337278461
Author:
Ron Larson
Publisher:
Cengage Learning

College Algebra
Algebra
ISBN:
9781305115545
Author:
James Stewart, Lothar Redlin, Saleem Watson
Publisher:
Cengage Learning
Trigonometry (MindTap Course List)
Trigonometry
ISBN:
9781337278461
Author:
Ron Larson
Publisher:
Cengage Learning
College Algebra
Algebra
ISBN:
9781305115545
Author:
James Stewart, Lothar Redlin, Saleem Watson
Publisher:
Cengage Learning