Consider the following table of data containing module marks for 5 students: Student_ID CCIT4020 CCIT4088 CCIT4092 20201234 64 29 81 20076236 16 21 42 20201224 70 62 58 20213134 16 17 51 20201299 79 50 61
Consider the following table of data containing module marks for 5 students: Student_ID CCIT4020 CCIT4088 CCIT4092 20201234 64 29 81 20076236 16 21 42 20201224 70 62 58 20213134 16 17 51 20201299 79 50 61

Chapter3: Performing Calculations With Formulas And Functions
Section: Chapter Questions
Problem 3.9CP

Related questions
Question
**using jupyter notebook (Python)**
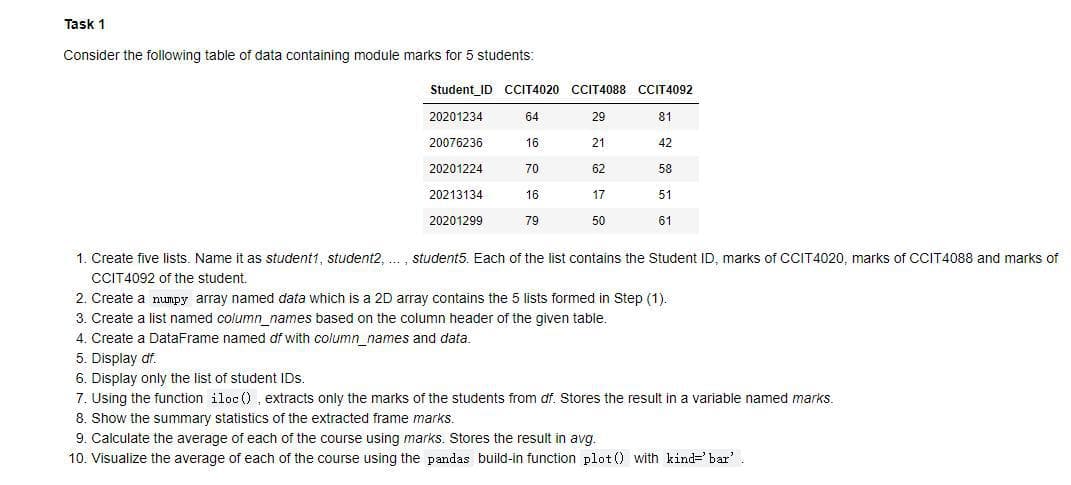
Transcribed Image Text:Task 1
Consider the following table of data containing module marks for 5 students:
Student_ID CIT4020 CCIT4088 CCIT4092
20201234
64
29
81
20076236
16
21
42
20201224
70
62
58
20213134
16
17
51
20201299
79
50
61
1. Create five lists. Name it as student1, student2, .. , student5. Each of the list contains the Student ID, marks of CCIT4020, marks of CCIT4088 and marks of
CCIT4092 of the student.
2. Create a numpy array named data which is a 2D array contains the 5 lists formed in Step (1).
3. Create a list named column_names based on the column header of the given table.
4. Create a DataFrame named df with column_names and data.
5. Display df.
6. Display only the list of student IDs.
7. Using the function iloc (), extracts only the marks of the students from df. Stores the result in a variable named marks.
8. Show the summary statistics of the extracted frame marks.
9. Calculate the average of each of the course using marks. Stores the result in avg.
10. Visualize the average of each of the course using the pandas build-in function plot() with kind=' bar'.
Expert Solution
This question has been solved!
Explore an expertly crafted, step-by-step solution for a thorough understanding of key concepts.

Step by step
Solved in 2 steps with 1 images

Knowledge Booster


Learn more about
Need a deep-dive on the concept behind this application? Look no further. Learn more about this topic, computer-science and related others by exploring similar questions and additional content below.Recommended textbooks for you
Np Ms Office 365/Excel 2016 I Ntermed
Computer Science
ISBN:
9781337508841
Author:
Carey
Publisher:
Cengage

A Guide to SQL
Computer Science
ISBN:
9781111527273
Author:
Philip J. Pratt
Publisher:
Course Technology Ptr
Np Ms Office 365/Excel 2016 I Ntermed
Computer Science
ISBN:
9781337508841
Author:
Carey
Publisher:
Cengage
A Guide to SQL
Computer Science
ISBN:
9781111527273
Author:
Philip J. Pratt
Publisher:
Course Technology Ptr