Consider the following three simple rules to represent fuzzy relationship between food quality and service in a restaurant as input variables and tip amount as output variables. 1) If the food is bad OR the service is poor, then the tip will be low 2) If the service is acceptable, then the tip will be medium 3) If the food is great OR the service is amazing, then the tip will be high. Given the membership functions illustrated in Figure 1 and 2 as follows. Food quality 1.0 Bad 0.8 Decent 0.6 Great 0.4 0.2 0.0 4 10 Service quality 1.0 Poor 0.8 Acceptable 0.6 Amazing 0.4 0.2 0.0 10 Figure 1. Food Quality and Service Membership Functions
Consider the following three simple rules to represent fuzzy relationship between food quality and service in a restaurant as input variables and tip amount as output variables. 1) If the food is bad OR the service is poor, then the tip will be low 2) If the service is acceptable, then the tip will be medium 3) If the food is great OR the service is amazing, then the tip will be high. Given the membership functions illustrated in Figure 1 and 2 as follows. Food quality 1.0 Bad 0.8 Decent 0.6 Great 0.4 0.2 0.0 4 10 Service quality 1.0 Poor 0.8 Acceptable 0.6 Amazing 0.4 0.2 0.0 10 Figure 1. Food Quality and Service Membership Functions

Computer Networking: A Top-Down Approach (7th Edition)
7th Edition
ISBN:9780133594140
Author:James Kurose, Keith Ross
Publisher:James Kurose, Keith Ross
Chapter1: Computer Networks And The Internet
Section: Chapter Questions
Problem R1RQ: What is the difference between a host and an end system? List several different types of end...

Related questions
Question
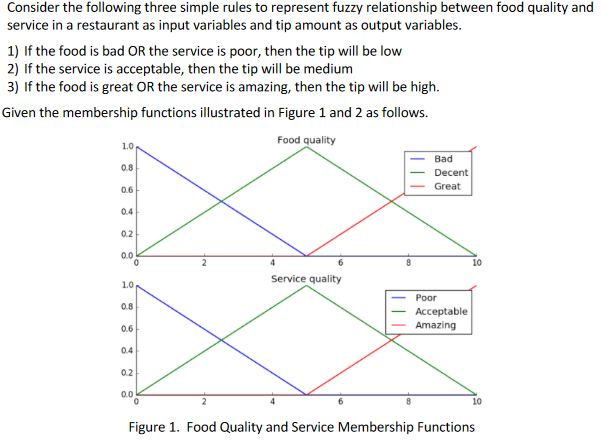
Transcribed Image Text:Consider the following three simple rules to represent fuzzy relationship between food quality and
service in a restaurant as input variables and tip amount as output variables.
1) If the food is bad OR the service is poor, then the tip will be low
2) If the service is acceptable, then the tip will be medium
3) If the food is great OR the service is amazing, then the tip will be high.
Given the membership functions illustrated in Figure 1 and 2 as follows.
Food quality
1.0
Bad
0.8
Decent
0.6
Great
0.4
0.2
0.0
Service quality
1.0
Poor
0.8
Acceptable
0.6
Amazing
0.4
0.2
0.0
10
Figure 1. Food Quality and Service Membership Functions
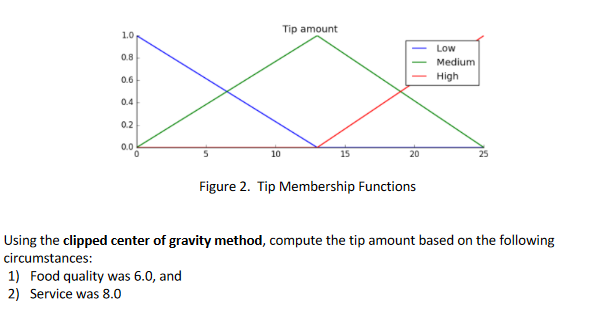
Transcribed Image Text:Tip amount
1.0
Low
0.8
Medium
High
0.6
0.4
0.2
0.0
10
20
Figure 2. Tip Membership Functions
Using the clipped center of gravity method, compute the tip amount based on the following
circumstances:
1) Food quality was 6.0, and
2) Service was 8.0
Expert Solution
This question has been solved!
Explore an expertly crafted, step-by-step solution for a thorough understanding of key concepts.

Step by step
Solved in 2 steps

Recommended textbooks for you
Computer Networking: A Top-Down Approach (7th Edi…
Computer Engineering
ISBN:
9780133594140
Author:
James Kurose, Keith Ross
Publisher:
PEARSON

Computer Organization and Design MIPS Edition, Fi…
Computer Engineering
ISBN:
9780124077263
Author:
David A. Patterson, John L. Hennessy
Publisher:
Elsevier Science

Network+ Guide to Networks (MindTap Course List)
Computer Engineering
ISBN:
9781337569330
Author:
Jill West, Tamara Dean, Jean Andrews
Publisher:
Cengage Learning
Computer Networking: A Top-Down Approach (7th Edi…
Computer Engineering
ISBN:
9780133594140
Author:
James Kurose, Keith Ross
Publisher:
PEARSON
Computer Organization and Design MIPS Edition, Fi…
Computer Engineering
ISBN:
9780124077263
Author:
David A. Patterson, John L. Hennessy
Publisher:
Elsevier Science
Network+ Guide to Networks (MindTap Course List)
Computer Engineering
ISBN:
9781337569330
Author:
Jill West, Tamara Dean, Jean Andrews
Publisher:
Cengage Learning

Concepts of Database Management
Computer Engineering
ISBN:
9781337093422
Author:
Joy L. Starks, Philip J. Pratt, Mary Z. Last
Publisher:
Cengage Learning

Prelude to Programming
Computer Engineering
ISBN:
9780133750423
Author:
VENIT, Stewart
Publisher:
Pearson Education

Sc Business Data Communications and Networking, T…
Computer Engineering
ISBN:
9781119368830
Author:
FITZGERALD
Publisher:
WILEY