Consider the following time series data. Week 1 2 3 4 5 6 Value 19 12 17 10 17 14 Using the naive method (most recent value) as the forecast for the next week, compute the following measures of forecast accuracy. (a) mean absolute error MAE (b) mean squared error MSE (c) mean absolute percentage error (Round your answer to two decimal places.) MAPE= % (d) What is the forecast for week 7?
Consider the following time series data. Week 1 2 3 4 5 6 Value 19 12 17 10 17 14 Using the naive method (most recent value) as the forecast for the next week, compute the following measures of forecast accuracy. (a) mean absolute error MAE (b) mean squared error MSE (c) mean absolute percentage error (Round your answer to two decimal places.) MAPE= % (d) What is the forecast for week 7?

A First Course in Probability (10th Edition)
10th Edition
ISBN:9780134753119
Author:Sheldon Ross
Publisher:Sheldon Ross
Chapter1: Combinatorial Analysis
Section: Chapter Questions
Problem 1.1P: a. How many different 7-place license plates are possible if the first 2 places are for letters and...

Related questions
Question
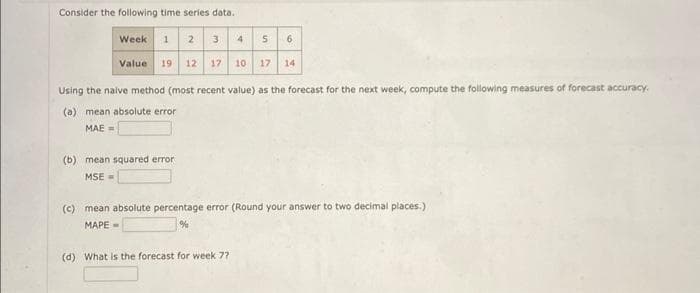
Transcribed Image Text:Consider the following time series data.
Week 1 2 3 4 5 6
Value 19 12 17
10 17 14
Using the naive method (most recent value) as the forecast for the next week, compute the following measures of forecast accuracy.
(a) mean absolute error
MAE=
(b) mean squared error
MSE=
(c) mean absolute percentage error (Round your answer to two decimal places.)
MAPE=
%
(d) What is the forecast for week 7?
Expert Solution
This question has been solved!
Explore an expertly crafted, step-by-step solution for a thorough understanding of key concepts.

This is a popular solution!

Trending now
This is a popular solution!

Step by step
Solved in 6 steps

Recommended textbooks for you
A First Course in Probability (10th Edition)
Probability
ISBN:
9780134753119
Author:
Sheldon Ross
Publisher:
PEARSON

A First Course in Probability (10th Edition)
Probability
ISBN:
9780134753119
Author:
Sheldon Ross
Publisher:
PEARSON