Consider the following. Year 1790 1800 1810 1820 P(t) = 1830 1840 1850 1860 1870 1880 1890 1900 1910 1920 1930 1940 1950 143.56 1+35.53e(-0.0353-1) Population (in millions) 3.929 5.308 7.240 9.638 (a) Census data for the United States between 1790 and 1950 are given in the table above. Construct a logistic population model using the data from 1790, 1860, and 1920. (Assume that t is years since 1790 and P is population in millions. Round all coefficients to four decimal places.) Year 1820 1910 12.866 17.069 23.192 31.433 38.558 (b) Construct a table comparing actual census population with the population predicted by the model in part (a). Compute the error and the percentage error for each entry pair. 50.156 62.948 75.996 91.972 Census Population. (in Millions) 9.638 91.972 105.711 122.775 131.669 150.697 Predicted Population (in Millions, rounded to three decimal places) 9.989 9.174 X Error (rounded to three decimal places) -0.351 0 % Error (rounded to two decimal places) -3.64 0 ✓ % %
Consider the following. Year 1790 1800 1810 1820 P(t) = 1830 1840 1850 1860 1870 1880 1890 1900 1910 1920 1930 1940 1950 143.56 1+35.53e(-0.0353-1) Population (in millions) 3.929 5.308 7.240 9.638 (a) Census data for the United States between 1790 and 1950 are given in the table above. Construct a logistic population model using the data from 1790, 1860, and 1920. (Assume that t is years since 1790 and P is population in millions. Round all coefficients to four decimal places.) Year 1820 1910 12.866 17.069 23.192 31.433 38.558 (b) Construct a table comparing actual census population with the population predicted by the model in part (a). Compute the error and the percentage error for each entry pair. 50.156 62.948 75.996 91.972 Census Population. (in Millions) 9.638 91.972 105.711 122.775 131.669 150.697 Predicted Population (in Millions, rounded to three decimal places) 9.989 9.174 X Error (rounded to three decimal places) -0.351 0 % Error (rounded to two decimal places) -3.64 0 ✓ % %

Related questions
Question
100%
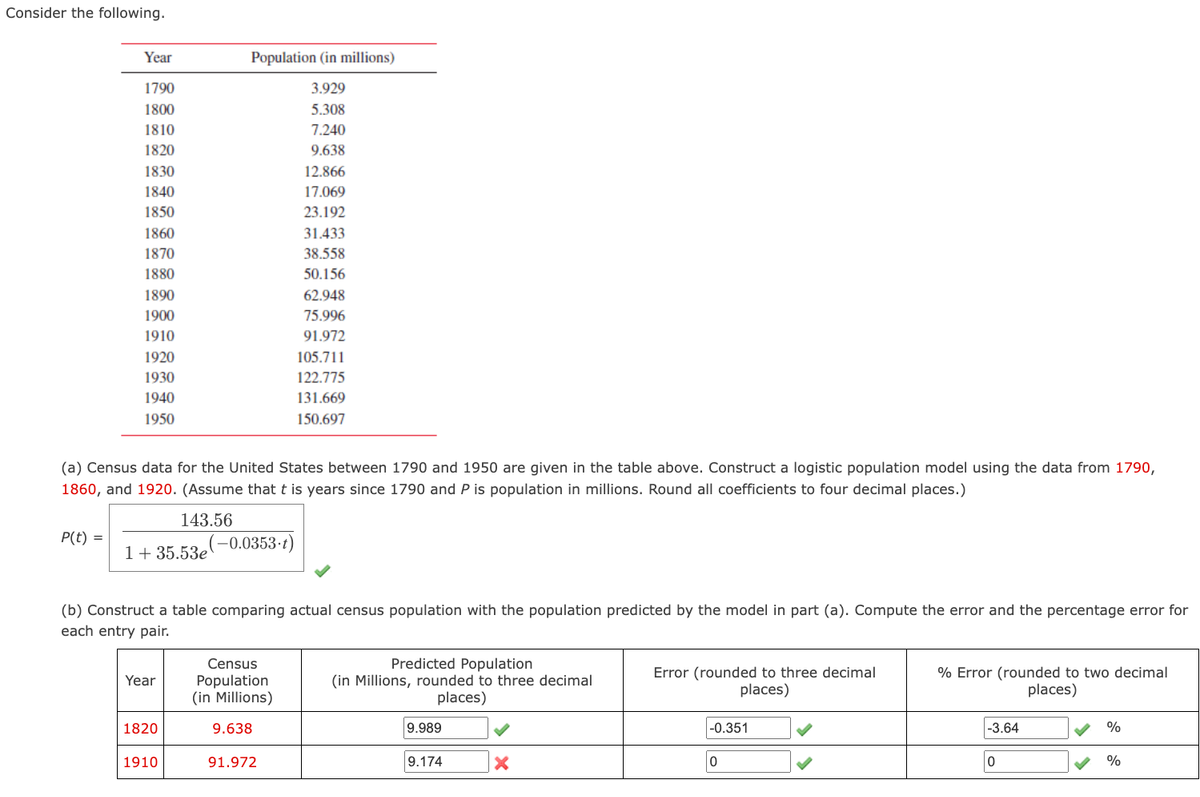
Transcribed Image Text:Consider the following.
Year
1790
1800
1810
1820
1830
1840
1850
1860
1870
1880
1890
1900
1910
1920
1930
1940
1950
P(t) =
(a) Census data for the United States between 1790 and 1950 are given in the table above. Construct a logistic population model using the data from 1790,
1860, and 1920. (Assume that t is years since 1790 and P is population in millions. Round all coefficients to four decimal places.)
143.56
1+ 35.53e
Year
Population (in millions)
3.929
5.308
7.240
9.638
12.866
17.069
23.192
31.433
38.558
50.156
62.948
75.996
91.972
1820
(b) Construct a table comparing actual census population with the population predicted by the model in part (a). Compute the error and the percentage error for
each entry pair.
1910
-0.0353-t)
105.711
122.775
131.669
150.697
Census
Population
(in Millions)
9.638
91.972
Predicted Population
(in Millions, rounded to three decimal
places)
9.989
9.174
X
Error (rounded to three decimal
places)
-0.351
0
% Error (rounded to two decimal
places)
-3.64
0
%
%
Expert Solution
This question has been solved!
Explore an expertly crafted, step-by-step solution for a thorough understanding of key concepts.

This is a popular solution!

Trending now
This is a popular solution!

Step by step
Solved in 6 steps with 5 images
